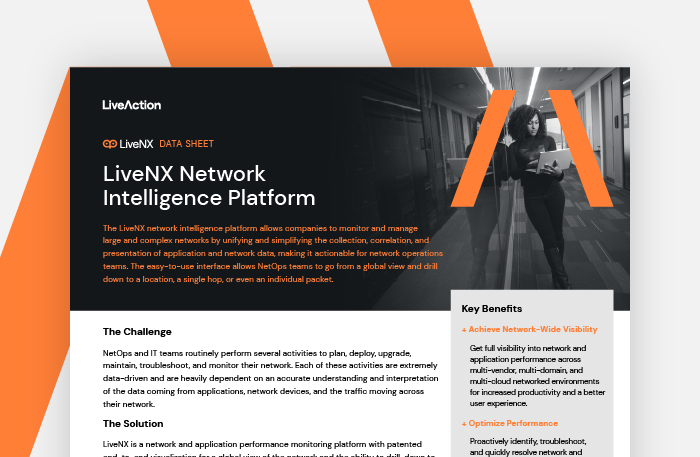
LiveNX Datasheet
Contents
The Challenge
Network Management teams routinely perform several activities to plan, deploy, upgrade, maintain, troubleshoot, and monitor the network. Each of these activities are extremely data-driven and are heavily dependent on the network team’s accurate understanding and interpretation of the data coming from applications, network devices and the traffic moving over their network.
The Solution
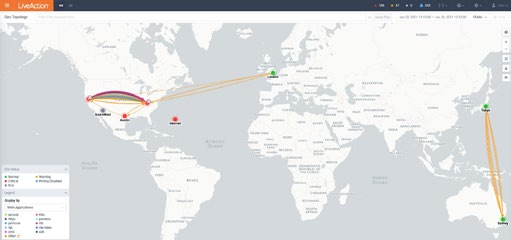
LiveNX is a network and application performance monitoring platform with patented end-to-end visualization for a global view of the network and the ability to drill-down to individual devices. Using LiveNX, enterprises gain real-time and continuous insight into network traffic based on application and user level activity.
LiveNX offers the ability to gather and analyze volumes of network data at scale from every device, application, and user to reduce mean time to repair, and it performs exploratory and explanatory analysis.
Key Benefits
- Achieve Network-Wide Visibility
get full visibility into network and application performance across multi-vendor, multi-domain and multi-cloud networked environments for increased productivity and a better user experience. - Optimize Performance
proactively identify, troubleshoot, and quickly resolve network and application performance issues regardless of where they occur to speed time to repair, avoid costly downtime, and meet business needs. - Unify Network Data
simplify network monitoring and accelerate troubleshooting by unifying all key network monitoring data types, including network packets, onto a single platform across the
entire network, so that IT staff can focus on strategic initiatives.
Key Capabilities
Unified Data on a Single Platform
- Correlate multiple data sets to provide views,graphs and maps to illustrate the current state of applications and network performance
- Gain visibility into underlay and overlays, tunnel performance for SD-WAN deployments
- See the entire network by unifying data from virtually anywhere – WAN, SD-WAN, WiFi,remote sites, data centers, and multi-cloud including AWS and Azure.
- Automatically do a device discovery and quickly create an exhaustive inventory of every Device and Interface in the network
Network Performance Monitoring
- Visualize devices, interfaces, applications, VPNs, and users.
- Overlay network and application performance data on your network topology to achieve a clear mental model of how the network relates to performance
- Baseline network performance – always understand what ‘normal’ is for your current network configuration and understand status deviations.
Application Monitoring and Troubleshooting
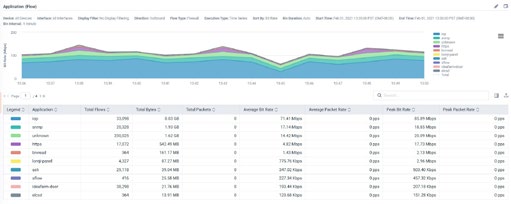
- Establish application and network performance baseline with real-time capture of line-rate rawflow data combined with filtering and big-dataanalysis and reporting
- Quickly resolve complex incidents that involve different systems, vendors, devices and software with a rapid incident response workflow with alert notification and predictive insight.
- Support application recognition facilitated by network device reporting or Deep Packet Inspection (DPI)
- Gather network performance metrics from infrastructure devices with application performance enriched Flow data for a comprehensive Application path analysis or hop-by-hop
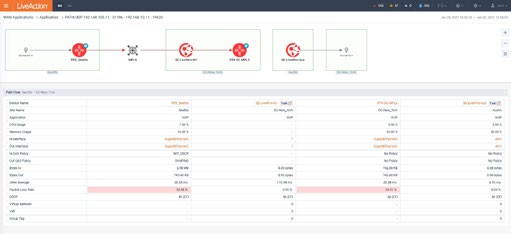
Integrated Flow and Packet Level Analysis
- End-to-end path analysis of application from on-prem to cloud on a single screen, workflow via Hop-by-hop analysis
- Support single-click drill down from flow visualization to packet analysis for detailed, root-cause analysis
- Rapid incident response with flow to packet analysis workflow optimization.
- Ability to go directly to packet data for root-cause analysis, for example, to see application errors in packet payloads
- Packet-by-packet ladder diagram for detailed application performance analysis
Reports and Dashboards
- Monitor network interface and component health
- Provide a Security Analysis report to show the de-duplicated flows from WAN Interfaces to identify potential security issues.
- Harness simplified dashboards and reporting with out-of-the-box standard reports and customizable report templates for network operations teams, executives and capacity planning
- Easily report on trends in organizational bandwidth utilization as well as individual users, devices and sites.
Monitoring, Alerting and Management
- Get real-time visualization exposing QoS anomalies and service provider traffic classification issues
- Support IP telephony monitoring (Jitter, Delay,MOS, latency, Bandwidth, Quality of calls, drops, etc.
- Monitor Cisco QOS classes per service per interface: queues and thresholds, dropped traffic etc.
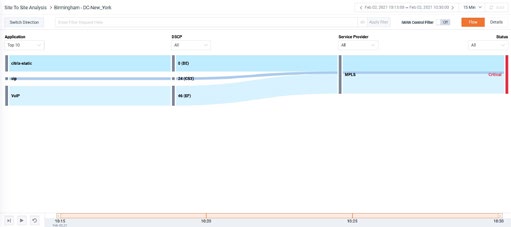
- SD-WAN management – utilize application andpath visualization to effectively validate WAN ROI for traditional MPLS, hybrid or SD-WAN.Gather real-time data from both multi-vendor network elements.
Available Add-Ons
- LiveWire
integrates with LiveNX to extend network monitoring and application troubleshooting to remote sites and branches, WAN edge, and data centers with high-performance packet capture and analysis. - LiveNCA
Network Configuration Automation integrates automated device discovery for a comprehensive multivendor asset inventory repository.
Network and Application Performance Monitoring Platform
LiveNX allows companies to manage large and complex network by unifying and simplifying the collection, correlation, and presentation of application and network data making it actionable for network management teams. The easy-to-use interface allows network management teams to go from a global view and drill down to a location, a single hop or even an individual packet.
Learn More
For more information about LiveNX specifications, please visit liveaction.com/livenx
Download LiveNX Data Sheet
About LiveAction®
LiveAction provides end-to-end visibility of network and application performance from a single pane of glass. We provide enterprises with confidence that the network is meeting business objectives, full network visibility for better decisions, and reduced cost to operate the network.