Background on The State of Network Visibility Limitations
There are certain limitations from Flow that obstruct the entire network picture. When Cisco acquired the Nexus platform (NX-OS), it was limited in terms of flow data.
SFlow
NX-OS supports S Flow which has certain use cases. At times, switches and weaker routers are ineffective at sending flow data. S Flow is lightweight enough to collect information without slowing down the network. S Flow takes a sampled rate of the data.
NetFlow
NX-OS also supports NetFlow which collects everything. It takes every single flow into consideration. NetFlow can be resource-intensive and requires a strong router.
IPFIX
What NX-OS does not support is flexible Netflow or IPFIX. This is the most modern variety and standardizes flow. IPFIX integrates SNMP data directly in the IPFIX packet, thus eliminating the need for packet capture services to collect data from each device. It allows us to put get more detail out of network performance.
Because NX-OS does not support IPFIX, Network Engineers are forced to use multiple tools to get a full picture of their Network Data.
LiveAction has integrated our packet capture product, LiveWire with our flow analysis platform, LiveNX so NetOps can enjoy a single view for all of their data.
ACI Visibility
With ACI fabric, the traffic goes from leaf to spine (the main connection points, and the core of their router).
ACI fabric is a software fabric-based overlay. The leaf server is attached to some kind of network or server farm as it goes to the data center.
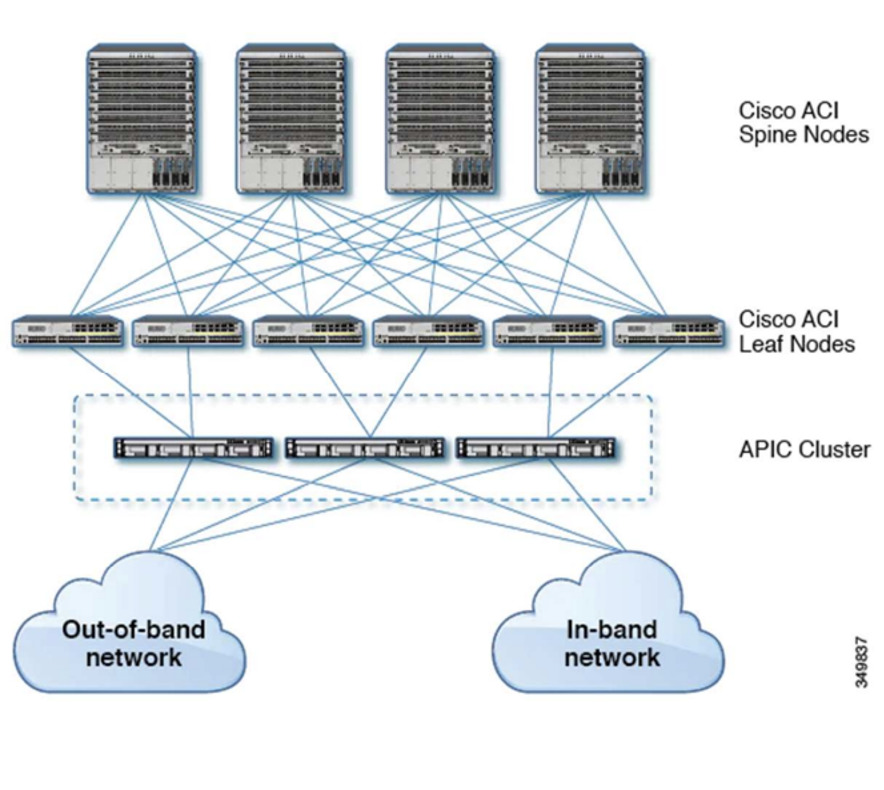
The underlay is all the connections to the servers’ fabric and actual network infrastructure.
The overlay is business-driven or logic-driven
VXLAN is what Cisco uses to bridge those two domains. the LAN is the underlay. the Cisco ACI overlay uses VXLAN to map where this goes to the underlay.
As an NPM, we have to read a VXLAN packet differently.
With LiveNX you are collecting flows, but you can only collect flows from the leaves. You cannot collect from the spine. The NX-OS spine switch (both virtual and physical) does not support IPFIX.
Flow Limitations with ACI
- Only basic NetFlow v9 (5 Tuple)
- Per Tenant
- No active/inactive, every 1 min
- No labels for bridge domain or interfaces
- Only leaf, No spine
- IPFIX only on EX/FX blades
- No performance metrics such as packet loss, jitter, client/server/app delay, etc.
LiveAction gets deeper packet analysis and performance metrics because we are generating an IPFIX flow. We span every single leaf and spine in the ACI fabric. All the underlay gets copied into our LiveWire. It taps and spans to generate data and flow and send that off to LiveNX for correlation.
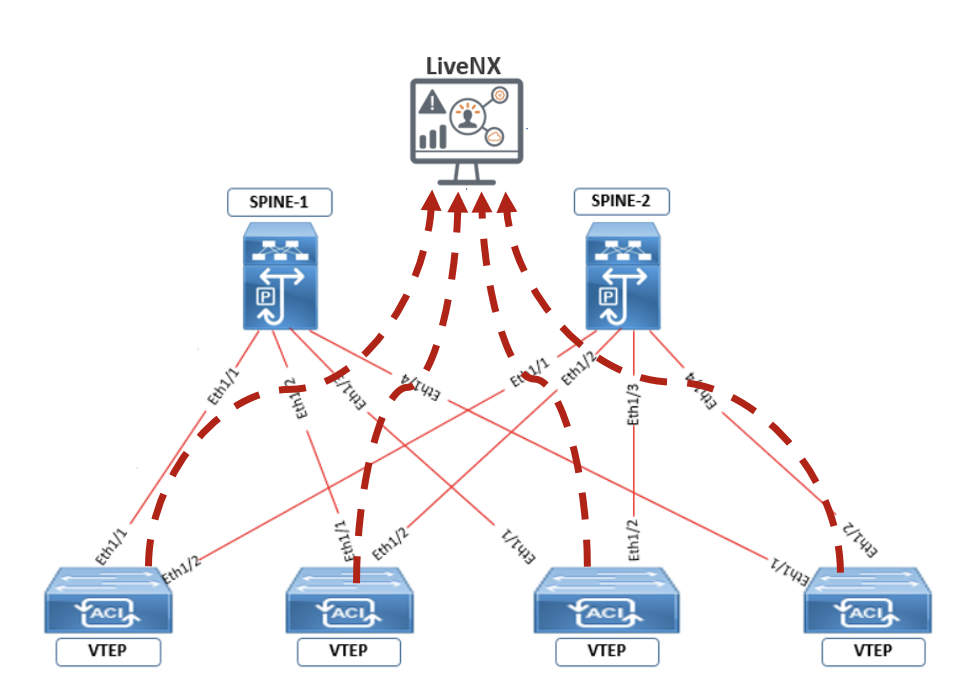
LiveWire not only sees spine to leaf interaction but also does performance analysis of packet loss jitter, client delay, server delay, app delay.
This allows network engineers to identify their VN ID- so they know where traffic is going. In the packet, we have a group policy ID – if we don’t encapsulate the VXLAN, we have no idea where that traffic is going.
Basic protocol analyzers and packet capture tools like Viavi and NetScout can do the VXLAN packet capture encapsulation. The problem is that those packet captures will not generate flow.
LiveWire can push this packet capture into LiveNX to generate flow.
We can take the ACI fabric and push that into LiveNX to can see the entire network. That’s the value of LiveNX. It shows flow across the entire enterprise, not just the overlay or underlay.
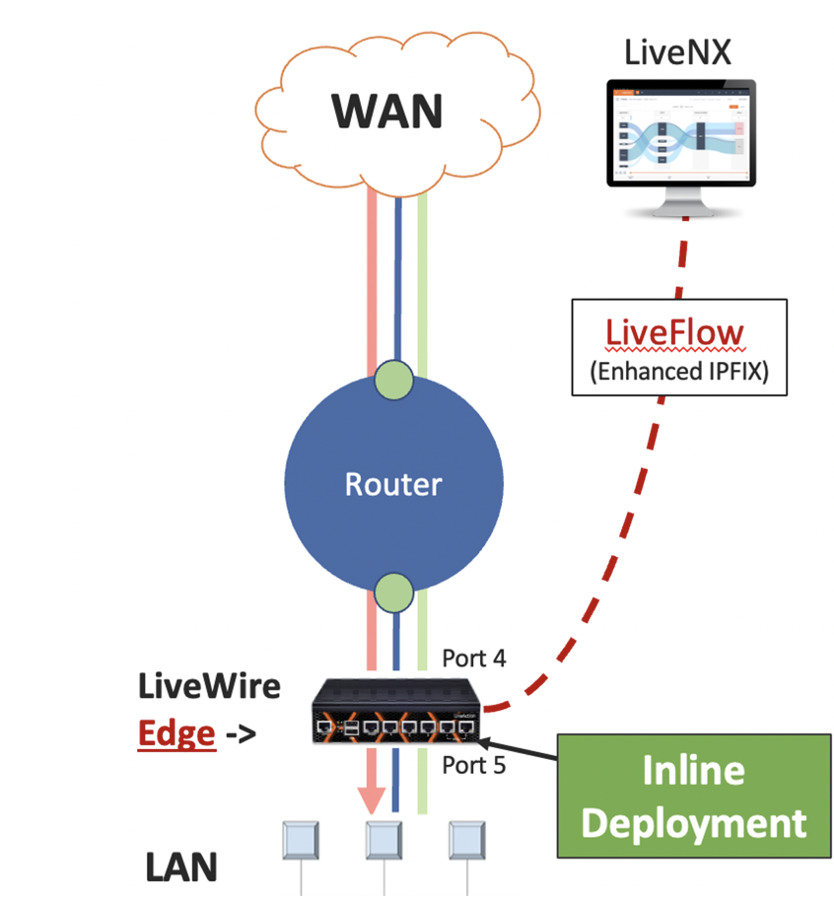
Sending flow detail to LiveNX we can now perform flow path analysis hop by hop and see exactly where traffic is going from the router perspective and from the wan perspective to track it its entire journey.
Taking data from the packets, summarizing it as an actionable flow from LiveNX and going into the packet allows for faster troubleshooting in the context of the ACI fabric, previously a blind spot of flow analysis tools.
Flow cannot show the whole path because you are limited to the NX-OS fabric from the flow detail, not the performance detail. The ACI fabric can drill into packets where needed. You can follow a WebEx or Teams conversation where the packet loss happens at the router.
ERSPAN vs. Tapping
With NX-OS, you can natively span traffic using a tunnel, that’s what ERSPAN is. We can also use taps which are better at collecting the data.
When a packet arrives and hits the switch, we can take an ERSPAN tunnel and send the traffic to our power core on a 1:1 basis.
When packets come in, they are sent from a SPAN port to the LiveWire core. But LiveWire can’t analyze the tunnel traffic immediately because it’s encrypted. It takes time to tear down the tunnel and start analyzing the data.
However, if we just tap it natively and send the traffic, we don’t have to do any additional work to tear down the tunnel. Therefore, tapping is the superior technique.
The Costs of ERSPAN vs. Tapping
ERSPAN is built into the switch. It’s free and easy to do, but you need a lot of LiveWire power cores to do the work, tear down tunnels, and take in the traffic. That work and time are where the cost is. For example, you need 10 LiveWires to do the work of tearing down the tunnels for 40 gigs of traffic. It’s a huge cost to analyze, even though taking in that traffic is free.
For tapping, you have to pay a third-party packet broker for the taps, like Gigamon or Ixia which can be costly. Spine and leaf switches gather all that SPAN traffic or path traffic using a third-party vendor – and LiveAction connects into that packet broker through one of our many integrations.
The bottom line is, you are either paying for the packet broker instrument to get all the data into one analyzer or using the ERSPAN you are paying to get all the data into multiple analyzers and have to pay for additional LiveWire devices.
ERSPAN Timing Accuracy
There is an important performance detail to consider with ERSPAN. The packet gets to the switch, and a tunnel is created with the packet data. This tunnel is sent to the analyzer where the encryption is torn down. The packet that arrives at the analyzer might wait to be admitted and for the tunnel to be torn down. The timestamp only reflects when the tunnel is torn down by the analyzer but does not record how long the data waited.
If the switch is busy doing its job, it will create the ERSPAN after it completes its other priorities. Meanwhile, the packets sit in a buffer sometimes dropping. When they are finally admitted to the packet analyzer is when the packets are time-stamped. The amount of time these packets sit in a queue buffering is unknown.
The Benefits of using a Tap
With a tap, this doesn’t happen. A packet hits the wire and is sent to, let’s say Gigamon, it is immediately forwarded to our analyzer with a precise and accurate timestamp. This small difference in time can be critical, especially in a Datacenter where timing needs to be 100% precise for accurate troubleshooting.
Pulling in ACI is a smart overlay strategy – if you are just using flow native to cisco it is incomplete. Netflow cannot see everything natively because switch fabric does not provide IPFIX flexible flow. Depending on your situation you may choose to use ERSPAN over tapping. Just note that if you are just using ERSPAN, you can expect your timing to be slightly off and you could lose packets.
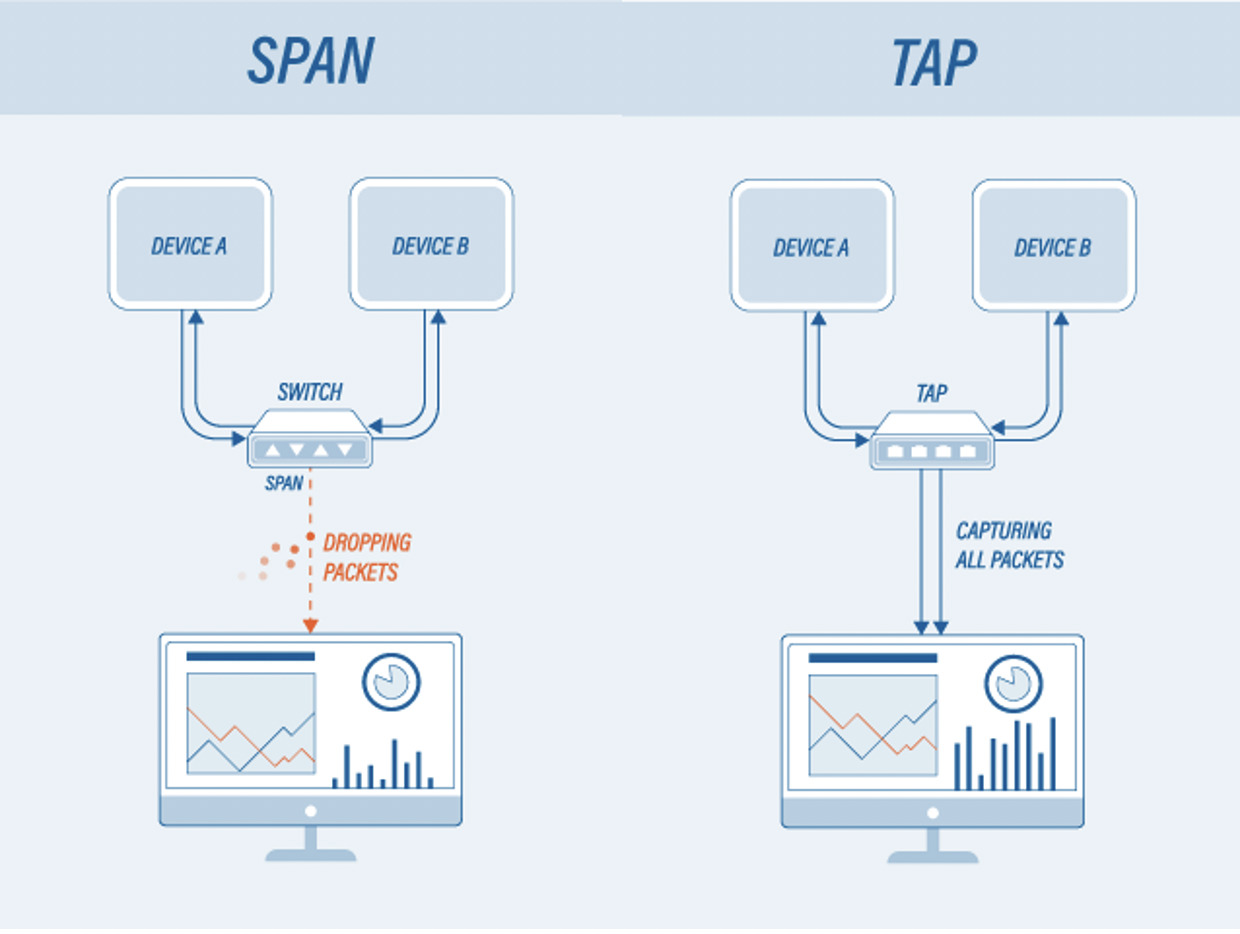
Image Source: profitap.com
About LiveAction
LiveAction gives you total visibility across the entire network with LiveNX flow path analysis and can be extended using LiveWire. LiveWire completes the picture and sends all the data to LiveNX to see what’s going on between the ACI fabric and the rest of the network. Our solution allows SDWAN fabric, and SDAccess fabric to all show up in LiveNX correlated and marked with performance metrics for easy monitoring and management.

