Cisco QoS Handbook

Contents
Protect your highest priority data with QoS.
When congestion happens. all packets have an equal chance of being dropped without QoS in place.
Our 58-page resource-rich Cisco QoS handbook covers every detail of QoS from creation to deployment and the best practices in between. Learn about:
- How QoS works
- Ways to classify traffic
- How to design and fine-tune QoS policies
- And much more inside…
Take advantage of LiveNX’s built-in capability to create and adjust policies graphically and understand network-wide traffic patterns visually.
How does QoS work?
Quality of Service (QoS) manages bandwidth usage across different applications and technologies. Its most common use is to protect real-time data applications like video or VoIP traffic. All network infrastructure devices have limits on the amount of traffic that can flow through them. In packet and frame switched networks, data is delayed or dropped during times of congestion. Quality of Service (QoS) management is the collection of mechanisms that control how traffic is prioritized and handled during these times.
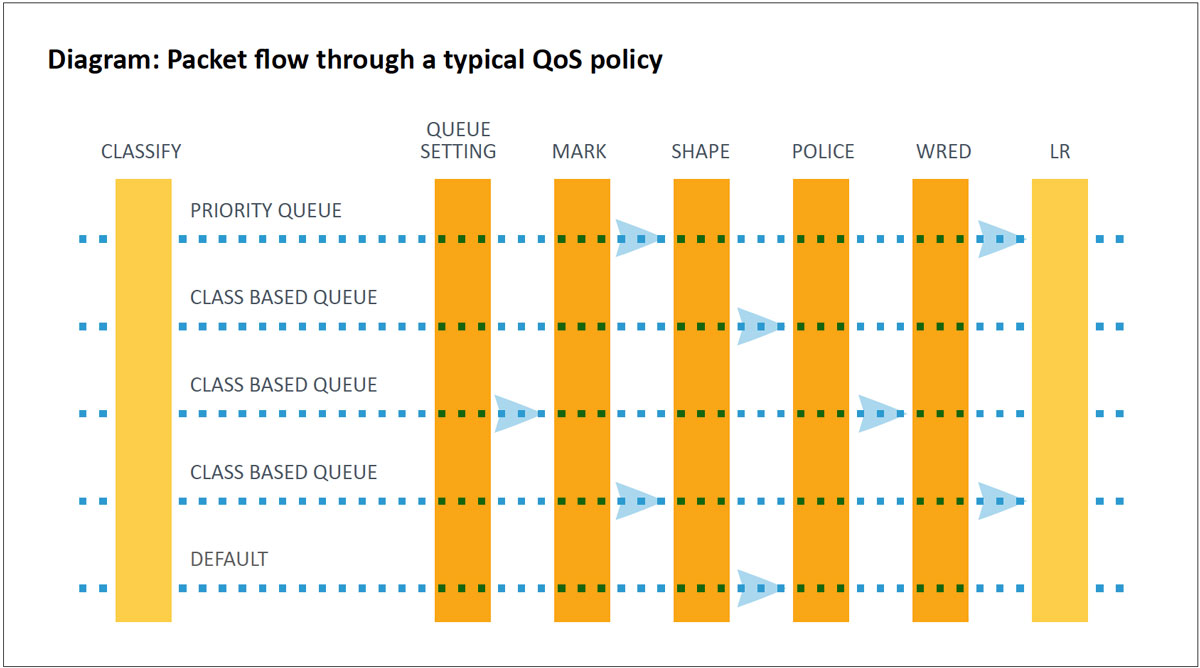
The two most common QoS tools used to handle traffic are classification and queuing. Classification identifies and marks traffic to ensure network devices know how to prioritize data as it crosses the network. Queues are buffers in devices that hold data to be processed. Queues provide bandwidth reservation and prioritization of traffic as it enters or leaves a network device. If the queues are not emptied (due to higher priority traffic going first), they can overflow and drop traffic.
Policing and shaping are also commonly used QoS technologies that limit the bandwidth used by predefined traffic types. Policing enforces bandwidth to a specified limit. If applications try to use more bandwidth than they are allocated, their traffic will be dropped. Shaping defines a software set limit on the transmission bandwidth rate of a data class. If more traffic needs to be sent than the shaped limit allows, the excess will be buffered. This buffer can then utilize queuing to prioritize data as it leaves the buffer.
The WRED (Weighted Random Early Discard) technology provides a congestion avoidance mechanism that will drop lower-priority TCP data to protect higher-priority data from being dropped.
Link-specific fragmentation and compression tools are used on lower bandwidth WANs to ensure real-time applications do not suffer from high jitter and delay.
Classification & Marking
The first step in a QoS configuration is determining an application’s packets and classifying them using Layer 2 or Layer 3 QoS markings. These markings identify them within the network.
Classification Methods
There are many ways to classify traffic. The most common are:
- Access Control Lists applied to a class map (IP address, port, etc.)
- Application Type applied to a class map (via NBAR or NBAR2)
- Switch port trust state
Once a packet is identified, it is marked near the source of the traffic flow and treated accordingly as it passes through the network. Marking is typically done at the Layer 3 IP header using the Differentiated Services Code Point (DSCP). LAN implementations use the Class of Service (COS) field. See Appendix B for best practices surrounding DSCP marking values.
There are two paradigms that are accepted as best strategies for how to classify and mark traffic. These are:
- The LAN
LAN Switches perform hardware-based QoS marking at wire speed. That’s why LAN access switches can be the best place to enable marking to take advantage of hardware-based QoS. Although these hardware-based QoS mechanisms do not significantly impact the CPU load on the switch, they often have limited configuration capabilities like consolidated, basic Access Control Lists for classifying traffic. Another consideration is the number of LAN interfaces that must be accurately configured to ensure proper classification and marking are working effectively. This is difficult to manage at scale. - The WAN
WAN routers such as Cisco ISRs and ASRs have more QoS matching and marking capabilities. This makes it easier to ensure traffic is marked as desired. There are also fewer interfaces that need to be configured correctly to successfully match and mark traffic at the WAN edge. The WAN edge is also where QoS congestion is most likely to occur. Matching and marking at the WAN edge ensures traffic is properly identified and prioritized where it is most needed. This strategy focuses on where QoS matters most and is simplest to deploy. The results are practically “good enough” vs. a more complex, technically accurate strategy.
Queuing
There are several types of queues built into network devices. For Cisco devices, the two most common are priority queues (PQs) and Class-Based Weighted Fair Queuing (CBWFQ). PQs are designed for packets that require low-latency and low-jitter treatment such as voice or video over IP. PQs will drop any oversubscription during congestion. CBWFQ is designed for bulk and transactional traffic that is not as time-sensitive. Each CBWFQ queue can specify a reserved bandwidth that is guaranteed to be available for use by that class during congestion. Queue depth can also be set to ensure traffic bursts can be handled by a queue.
Congestion avoidance mechanisms, such as Weighted Random Early Detection (WRED), can be used to drop packets as the queues fill up in order to throttle back TCP-based applications. There are also settings for class-based queues that reduce the possibility of congestion. These settings use DSCP markings to determine the priority of packets before the queue becomes full and they are dropped.
Shaping and Policing
Policing checks the packet rate for a particular classification of flows to sees if it conforms to the specified rate settings (e.g., a packet flow for a certain source is set not to exceed 50 Kbps). The policer checks to see if there is excess traffic, and if so, will drop the packets to conform to the specified rate.
The policer can specify thresholds for exceeding and can take actions that include marking down DSCP values instead of dropping packets. Markdown changes the DSCP value in the IP packet based on flow conditions, which changes the priority of the packet as it crosses the network.
Shaping involves delaying packets that exceed a software-defined threshold. If more data is trying to be sent than the shaped threshold, packets are held in the buffer until a later time when they can be sent out. This smooths outbursts, but unlike policers, shaping tries not to drop packets. Queuing policies can be assigned to the shaped buffer to prioritize applications as they leave the buffer. If there is congestion despite the shaping, the buffer may overflow, causing dropped packets.
Link Efficiency Mechanisms
- LLFI for MLP—(Link Fragmentation and Interleaving for Multilink PPP)—MLP splits, recombines, and sequences datagrams across multiple logical data links.
Large delay-sensitive datagrams are multilink encapsulated and fragmented into smaller packets to satisfy delay requirements. Small delay-sensitive packets are not encapsulated but are interleaved between these fragments. - LFI for frame relay (FRF.12)—FRF.12 fragments packets larger than the settings specified using the frame-relay fragment_ size command.
Frame Relay cannot distinguish between VoIP and data; therefore, configure the fragmentation size on the DLCI, so voice frames are not fragmented. The fragment size is specified in bytes (default = 53 bytes). Many variables determine the size of the voice packets. - CRTP—Compressed real-time protocol (CRTP) reduces in-line overhead for multimedia RTP traffic resulting in a corresponding reduction in delay. CRTP is especially beneficial when the RTP payload size is small such as compressed audio payloads of 20 to 50 bytes.
CRTP should be used on any WAN interface where bandwidth is a concern, or there is a high portion of RTP traffic. Note that CRTP requires more processing on the routers.
QoS Deployment Lifecycle
To make the process as manageable as possible, QoS deployments should be broken into discrete sequential stages. A typical implementation would follow these stages:
- Project Planning
Understand the current and near-future QoS needs of the organization. Choose an appropriate QoS model. - Investigation
Discover and document current and future network architecture. This includes:- Gather snapshots of existing QoS policies
- Research the QoS capabilities of the network devices
- Baseline the network with flow monitoring and usage analysis
- Design
Select a QoS model(s) for the traffic classes and define QoS policies for headquarters and campus LANs, WANs and branch offices, and VPNs. - Proof of Concept (POC)
Test QoS policies and settings in a non-production environment using real and synthetic traffic to generate controlled conditions. Test separately for each policy and then with all policies combined. - Iterative Deployment Cycle
Roll out QoS policies in a phased approach, either by network sections or by QoS functions (classification then queuing). Confirm changes at each iteration for at least 24 hours before continuing to the next step. - Ongoing Monitoring and Analysis
Perform ongoing monitoring and adjust the policies for average daily usage and monthly, quarterly, and yearly business cycles.
Project Planning
The first step to any successful project is a good plan.
This plan involves understanding the QoS needs of the organization, choosing the QoS model that fits these needs, designing the implementation, and implementing that design.
A good plan starts with understanding the businesses’ current and near-future needs. This will define the size and scope of the implementation.
Investigation
Make any significant hardware or software changes prior to rolling out a new QoS policy. Snapshot any existing QoS policies if changes need to be rolled back later. Understand the current network architecture. This includes understanding the applications used to support the network and the traffic running over it. If QoS has not been deployed on the network before, research what QoS capabilities are available in the network devices.
Baseline the network’s traffic.
Use a NetFlow monitoring application to analyze network traffic information. This information will reveal utilization patterns of current network applications and help spot problems. This data could indicate that network infrastructure changes are needed to support new bandwidth-intensive applications. Remember, QoS does not create bandwidth; it can only optimize bandwidth.
Design
Once a solid understanding of current and future QoS requirements is gathered, it’s time to begin the QoS design.
Select a QoS model and the router and switch policies that will support the model. Policies will need to be tailored to the different areas of the network. Depending on the network’s complexity, this may include access, distribution, core, WAN edge, remote offices, and security networks and devices. QoS policies may also be implemented at the Internet edge services for VPN users if voice applications are accessed remotely.
Several standardized QoS models can be chosen to support the number of classes required in the network infrastructure. Cisco has defined several models from 3, 4, 5, 8, and 11 classes to the latest 12 class Medianet model. More classes are not necessarily better for an organization due to hardware limitations, MPLS service provider restrictions, and insufficient IT resources to manage the extra complexity.
Many networks implement multiple class models for various sections of their environment. For initial QoS deployment, a smaller 3, 4, or 5 class model, can simplify the process. As additional applications and requirements arise, the model can easily be expanded over time.
See Appendix A – QoS Best Practices for a reference when designing QoS policies.
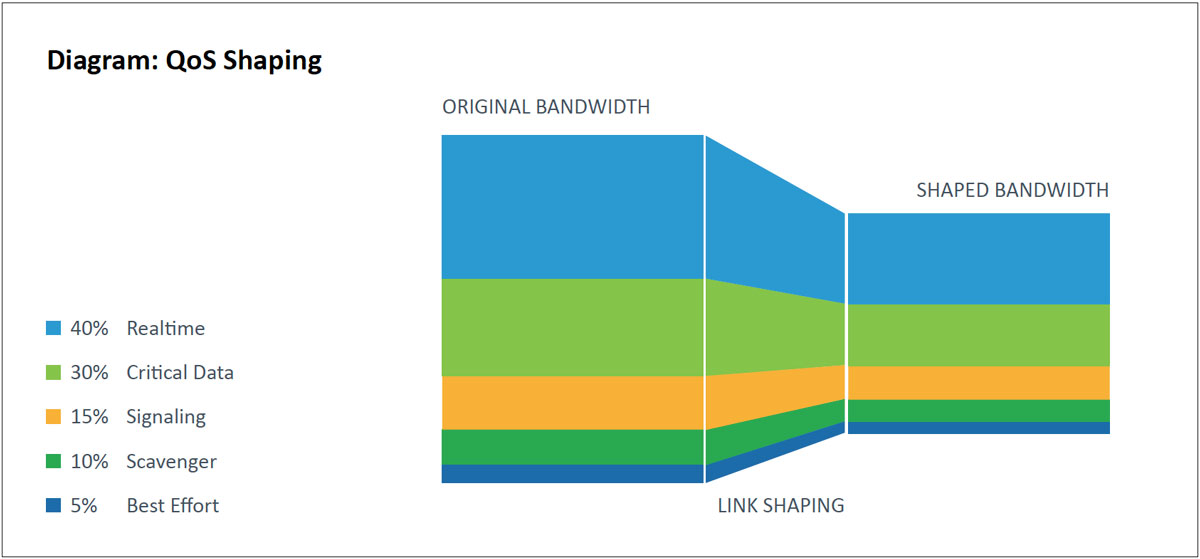
If high-priority traffic crosses the WAN links, you may need to upgrade service levels with your provider to support multiple priority levels. Inquire if the service provider has a QoS policy on their network. If not, all QoS markings get disregarded. Traffic can still be prioritized as it leaves the network, but there is no guarantee of its treatment. For many WAN environments, there will be a link-speed mismatch between a WAN link’s physical capabilities and the Committed Information Rate (CIR) purchased by the service provider. This is most common on high bandwidth metro Ethernet WANs and MPLS networks where the service providers are not using QoS. These designs use hierarchical policies that shape the QoS policy to the WAN link capacity.
Hierarchical WAN traffic shaping involves creating a high-level (parent) shaping policy and associating it with a lower-level (child) policy. This policy makes the interface shape all outgoing traffic. Once shaped, the lower level QoS policy queues traffic based on the shaped value and not the raw interface speed itself. Queuing results when the shaped value becomes congested.
The committed burst (BC) and excess burst (BE) should be configured to ensure optimum performance for real-time traffic like VOIP and video. The BC should be set to a value less than or equal 1/100 of the target shaped rate (CIR). This value may be increased to 2/100 for immersive video over IP deployments. The BE should permanently be configured as 0.
Proof of Concept
Any significant QoS deployment must start in the test lab. This is where configuration settings can be tested and validated in a non-production environment. Ideally, the test lab will have the same routers, switches, and software versions as the production network.
Real and synthetic traffic should be generated in controlled conditions similar to the production network to check the operation of QoS policies and settings. This process must be repeated for each policy, and finally, all policies together.
Iterative Deployment
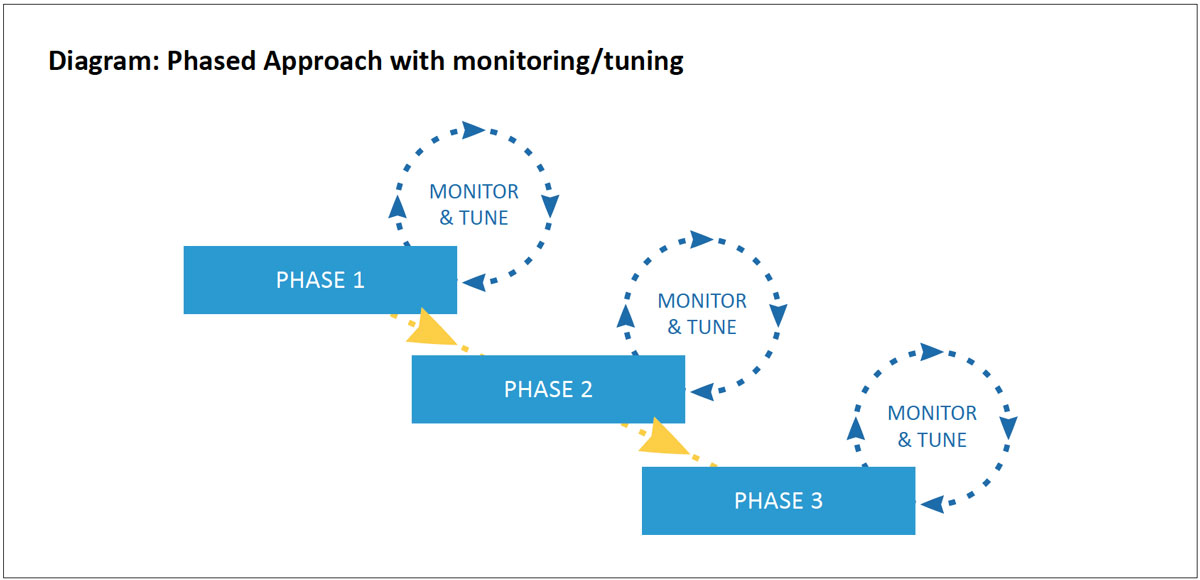
Once QoS policies have been validated in a test environment, you can begin a phased rollout.
At each phase, a change is made, confirmed through monitoring, and deployment moves on to the next phase until the project is complete. This method allows the project to move on a flexible schedule that can be interrupted between phases while maintaining business continuity.
There are different scenarios to choose from for your phased approach. One option is to pick a small portion of a larger network for initial deployment. For example, a remote site with a smaller network. Another option is to deploy the policies by function. For example, the first phase would start with just the classification and marking policies on endpoints and network devices. The traffic can be monitored to determine if the markings are applied correctly. Once confirmed, queuing, policing, and LFI mechanisms can be deployed systematically.
At each stage of policy deployment, the traffic and QoS policies need to be monitored for proper operation and tweaked if issues are uncovered. This monitoring should occur for at least 24 hours but ideally an entire week to catch different usage patterns throughout the workday and week. Repeat this monitoring and fine-tuning until the deployment is complete.
Ongoing Monitoring and Analysis
A QoS-enabled network requires ongoing monitoring and maintenance. Over time, changes occur to usage patterns, new applications are deployed, and these changes need to be incorporated into the existing policies. Take into consideration cyclical usage patterns. The most obvious is the workweek cycle, where traffic occurs in 10-12-hour cycles from Monday to Friday. However, other cycles occur at the end of fiscal periods, such as monthly, quarterly, and yearly. During these times, voice calls and ERP usage may peak due to accounting, manufacturing, sales, or internal meeting activities, and these usage patterns will need to be accounted for.
Tools for Successful QoS Implementation
Implementing QoS requires various functions, from monitoring and analysis to configuration and testing. Budgeting for QoS deployments needs to include funding for network management software tools. These tools will ensure accurate and effective QoS policy creation and enable a deeper understanding of the network environment for capacity planning, tuning, and troubleshooting efforts.
This table summarizes specific functions and technical considerations that should be evaluated when purchasing network management software for QoS:
| Function | Use | Tool Considerations |
|---|---|---|
| Traffic monitoring and analysis |
|
|
| QoS monitoring and analysis | QoS policy validation and ongoing monitoring |
|
| QoS design and configuration | Assist in defining QoS policies and actual configuration of the network devices |
|
| Synthetic traffic generation and analysis | Traffic generation and analysis for measuring the impact of QoS policies in a controlled manner |
|
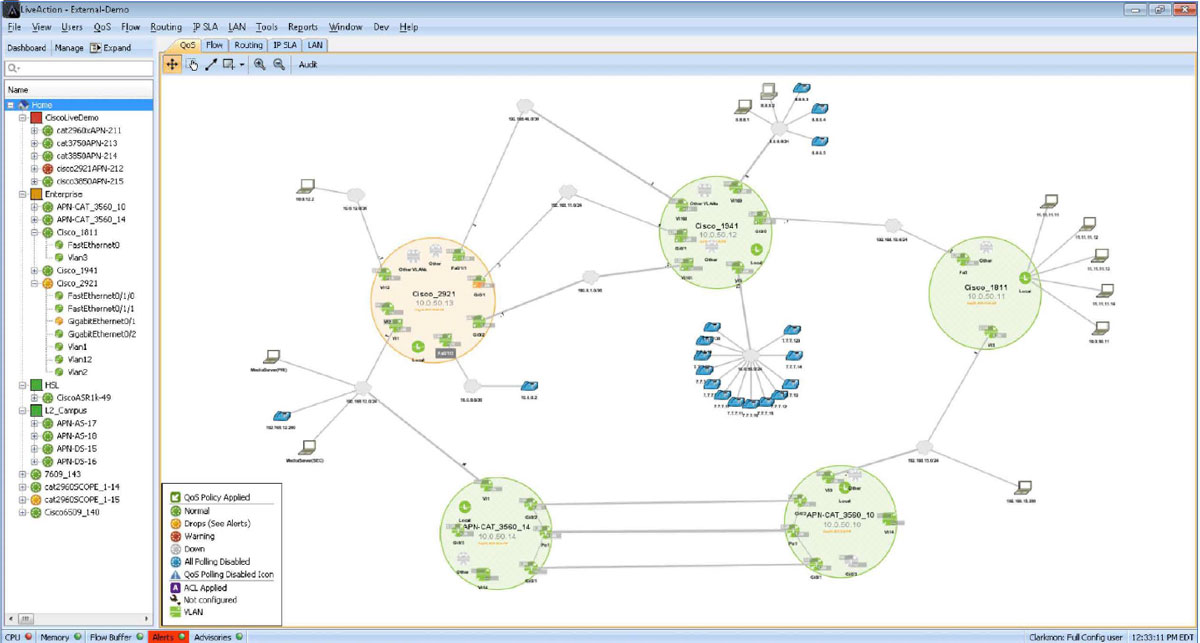
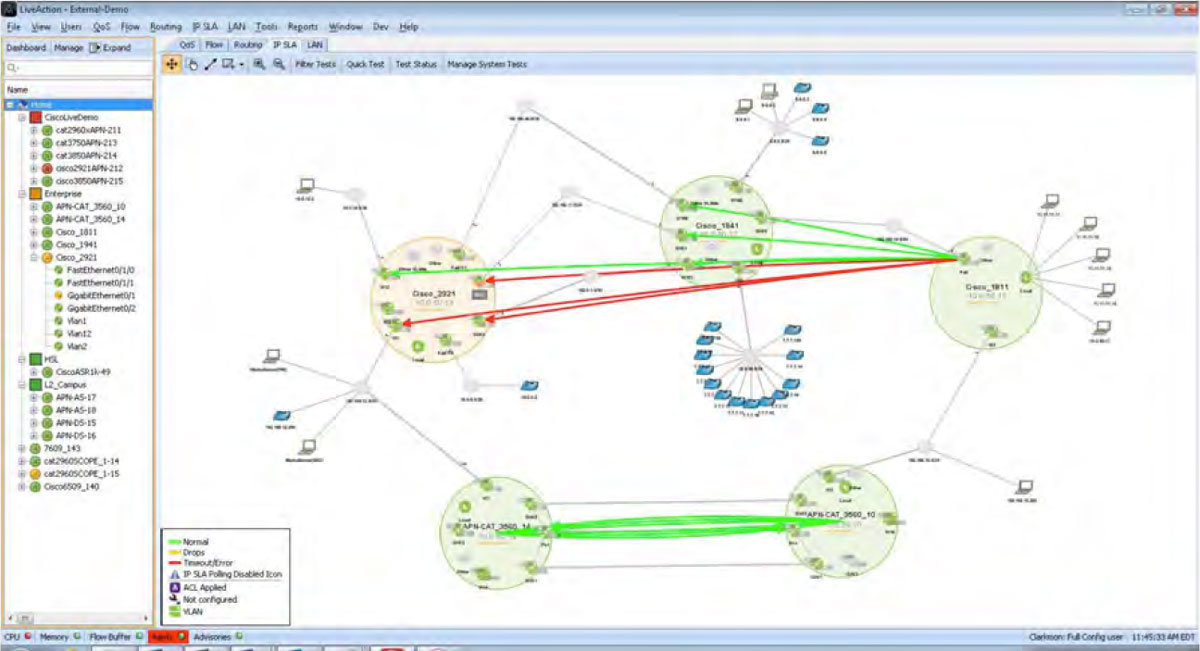
The image below is a view of the LiveNX console. It shows a network diagram consisting of five devices and multiple PCs, servers, and IP phones. The five larger green circles represent routers and switches managed by LiveNX. The little circles within the devices represent their interfaces. Four of the devices are green indicating good network performance. One device is amber, indicating that this device is having a network/QoS performance issue.
Traffic Monitoring & Analysis
The early stages of a QoS deployment involve information gathering used to design QoS policies.
For information gathering, NetFlow, NBAR, and SNMP monitoring and reporting tools are required. Using QoS monitor-only policies is also beneficial in the information-gathering stages. The tools used for monitoring these technologies need to support historical traffic analysis and reporting at 1-minute or better views (no averaging) to understand the network’s data usage prior to creating a QoS policy design.
LiveNX provides real-time and historical views and tailored reports for QoS deployments. The following three LiveNX screenshots show the real-time view of a single interface’s performance from four different technologies perspectives. These specific views can highlight the volume of data each application utilizes on the interface for the last ten minutes. This data can then be used for real-time capacity planning of QoS policies.
The diagram below shows an interface’s network performance from NetFlow’s perspective. This view details bandwidth by TCP/UDP port usage.
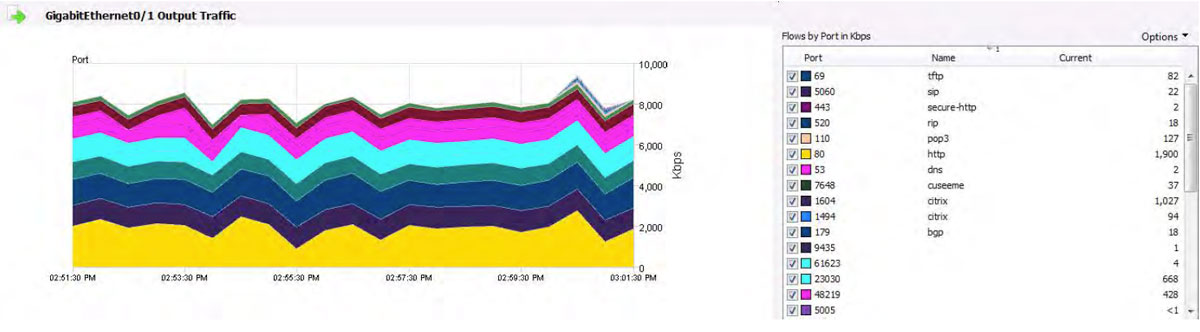
The diagram below shows an interface’s network performance from NBAR’s perspective.
The view details bandwidth by the application usage. The dotted black line shows interface SNMP’s bandwidth usage.

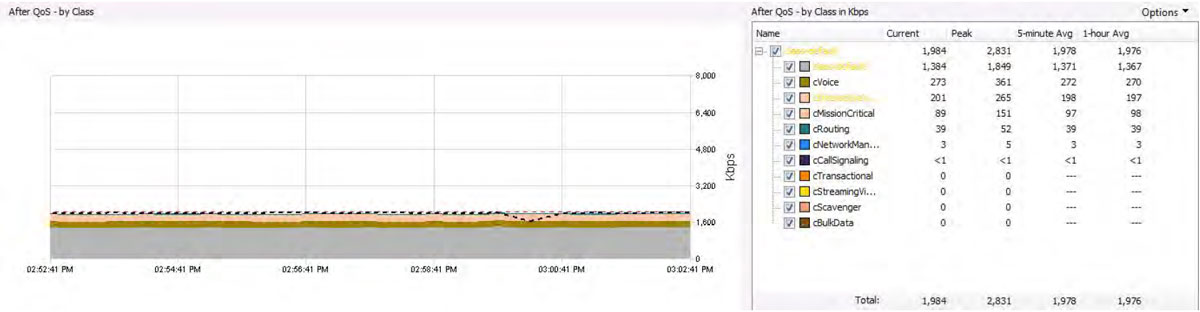
The diagram below shows an interface’s network performance from a QoS perspective.
The view details bandwidth usage by the queue. The dotted black line shows the interface’s SNMP bandwidth usage.
LiveNX includes a historical reporting tool. Traffic monitoring and analysis for QoS policy creation should have at least one week’s worth of historical data for accurate policy creation. The following screenshots highlight a subset of the reports available in LiveNX used in planning a QoS deployment. The reports shown below should be run on multiple devices and interfaces to understand a network’s overall application usage. Note that all historical reports in LiveNX can show data at 1-minute granularity.
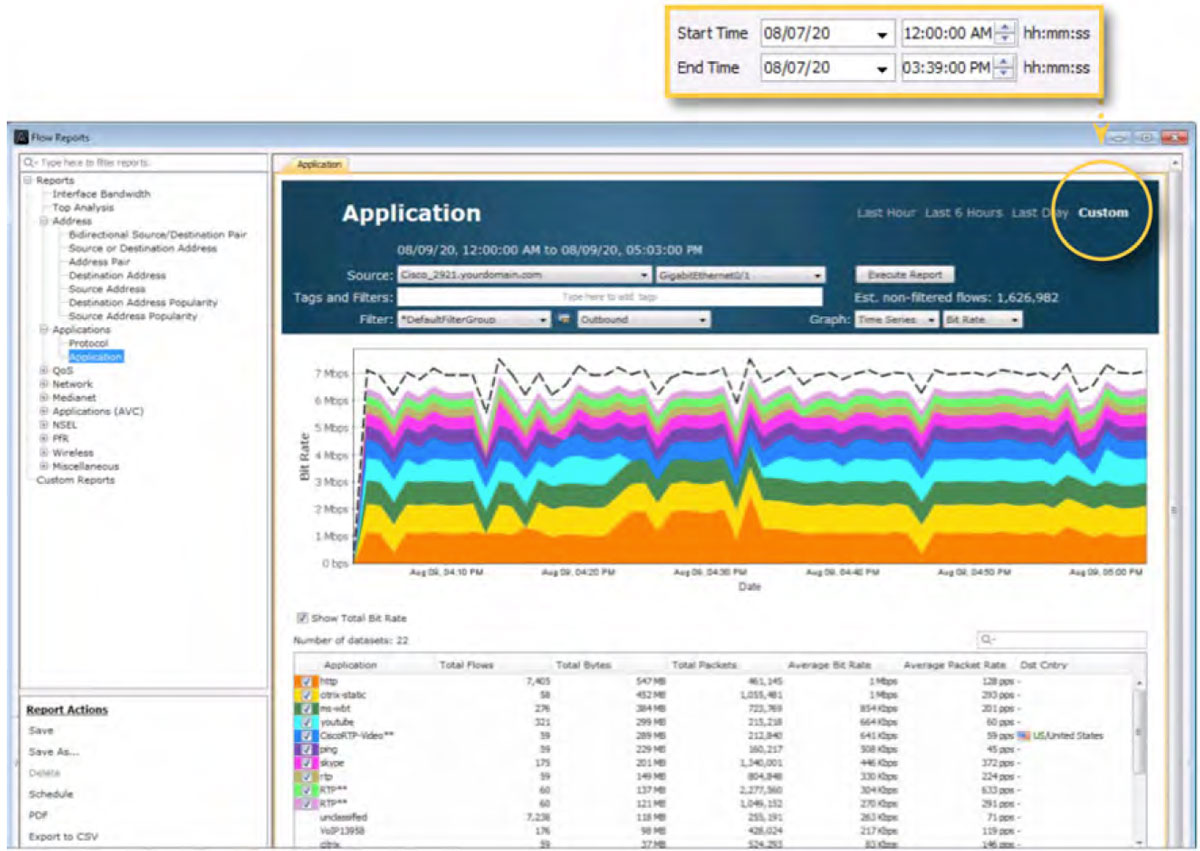
The following diagram shows a historical NetFlow Application report for the same interface highlighted above. The report can be tailored to a desired historical time by using the Custom option.
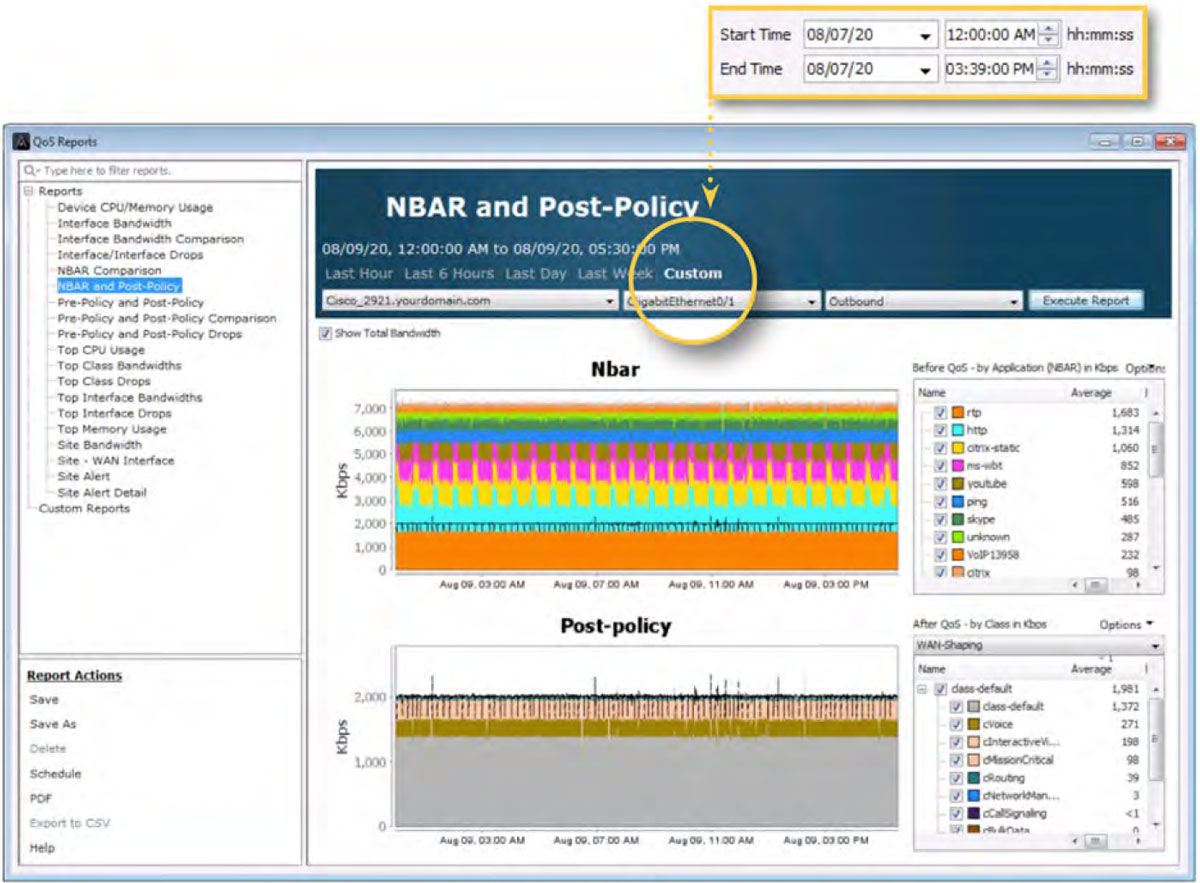
The diagram below shows the QoS historical report: NBAR and Post-Policy. This view presents the NBAR and QoS data for the same interface highlighted above. This report can gather the volume of bandwidth each application is utilizing on an interface for the period selected. If QoS monitoring policies are being used, as the screenshot below shows, queue bandwidth sizing can be determined for the QoS design.
QoS Design & Configuation
Designing QoS policies and configuring them on routers is a time-consuming, complex, and intimidating process that requires trained engineers. Using a QoS tool with GUI wizards, templates, interactive screens for designing, deploying, and adjusting QoS policies simplifies the process.
With LiveNX, engineers can promptly deploy Cisco recommended 12, 11, 8, 5, 4, or 3 class model QoS policies.
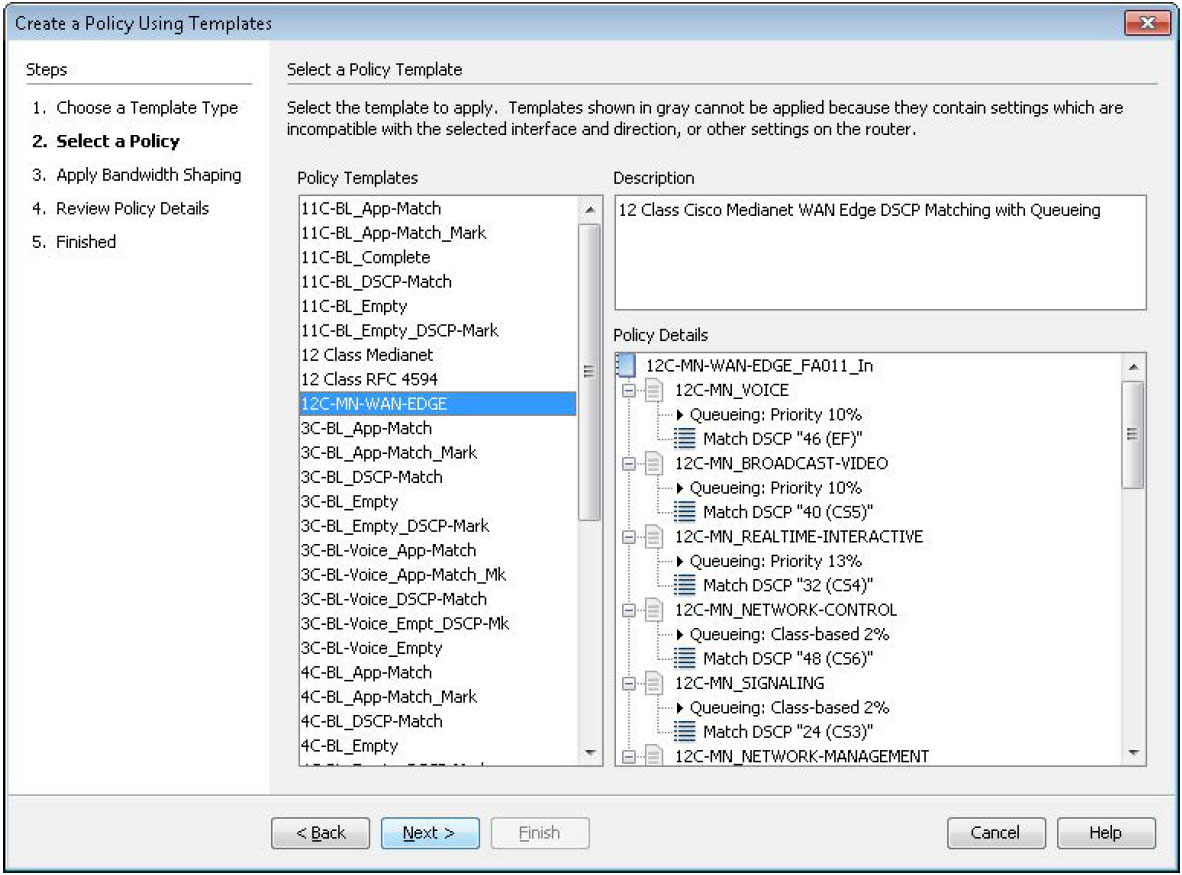
The Create a Policy Using Templates wizard dialog box is shown in the diagram to the right. The Cisco 12 Class Medianet WAN Edge policy is selected.
LiveNX has built-in QoS monitoring templates for either NBAR or ACLs. These monitor-only templates do not prioritize any applications but enable baselining traffic patterns.
A diagram of an ACL Monitor template wizard dialog box is below.
LiveNX has a GUI called Manage QoS Settings that provides engineers a point-and-click interface to create, edit and deploy custom QoS policies. This QoS configuration interface has built-in rules, checking, and reference information to warn engineers about configuration issues. LiveNX replaces the complex CLI commands associated with QoS.
Using LiveNX, engineers can:
- Create advanced QoS queuing policies with WRED congestion avoidance
- Classify and match traffic to classes using ACL, NBAR, DSCP value, and more.
- Implement policing and shaping policies
- Create hierarchical QoS policies
- Deploy standardized QoS policies to the rest of the network
- Revert changes as needed
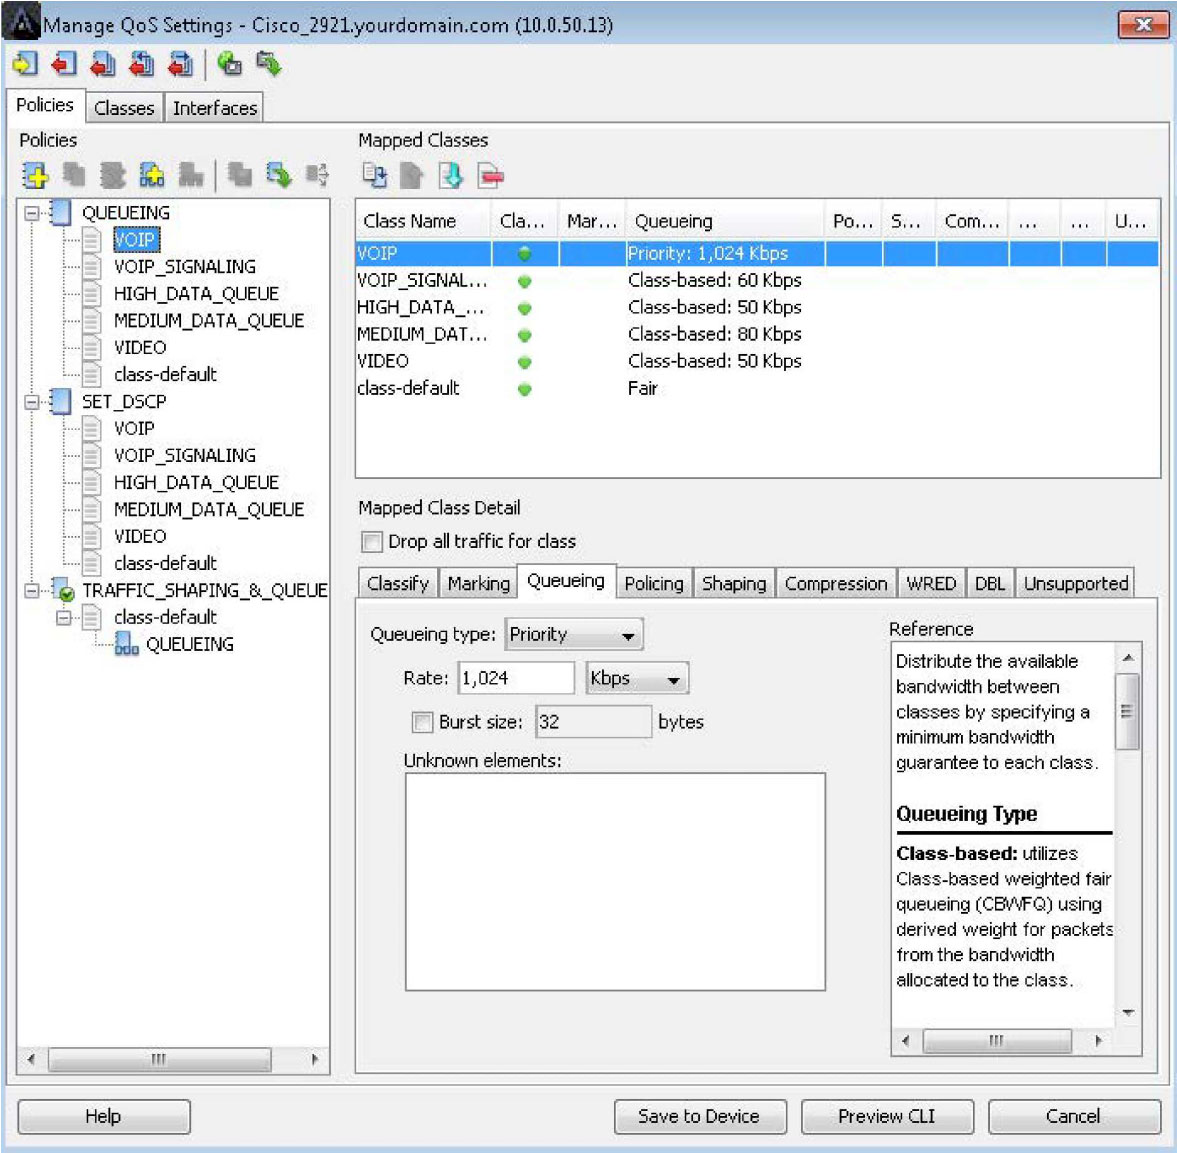
Below is a screenshot of the Manage QoS Settings window. The queuing configuration is shown for a class named VOIP in the example below. The bandwidth rate of this queue can be determined from the real-time and historical reports collected by LiveNX.
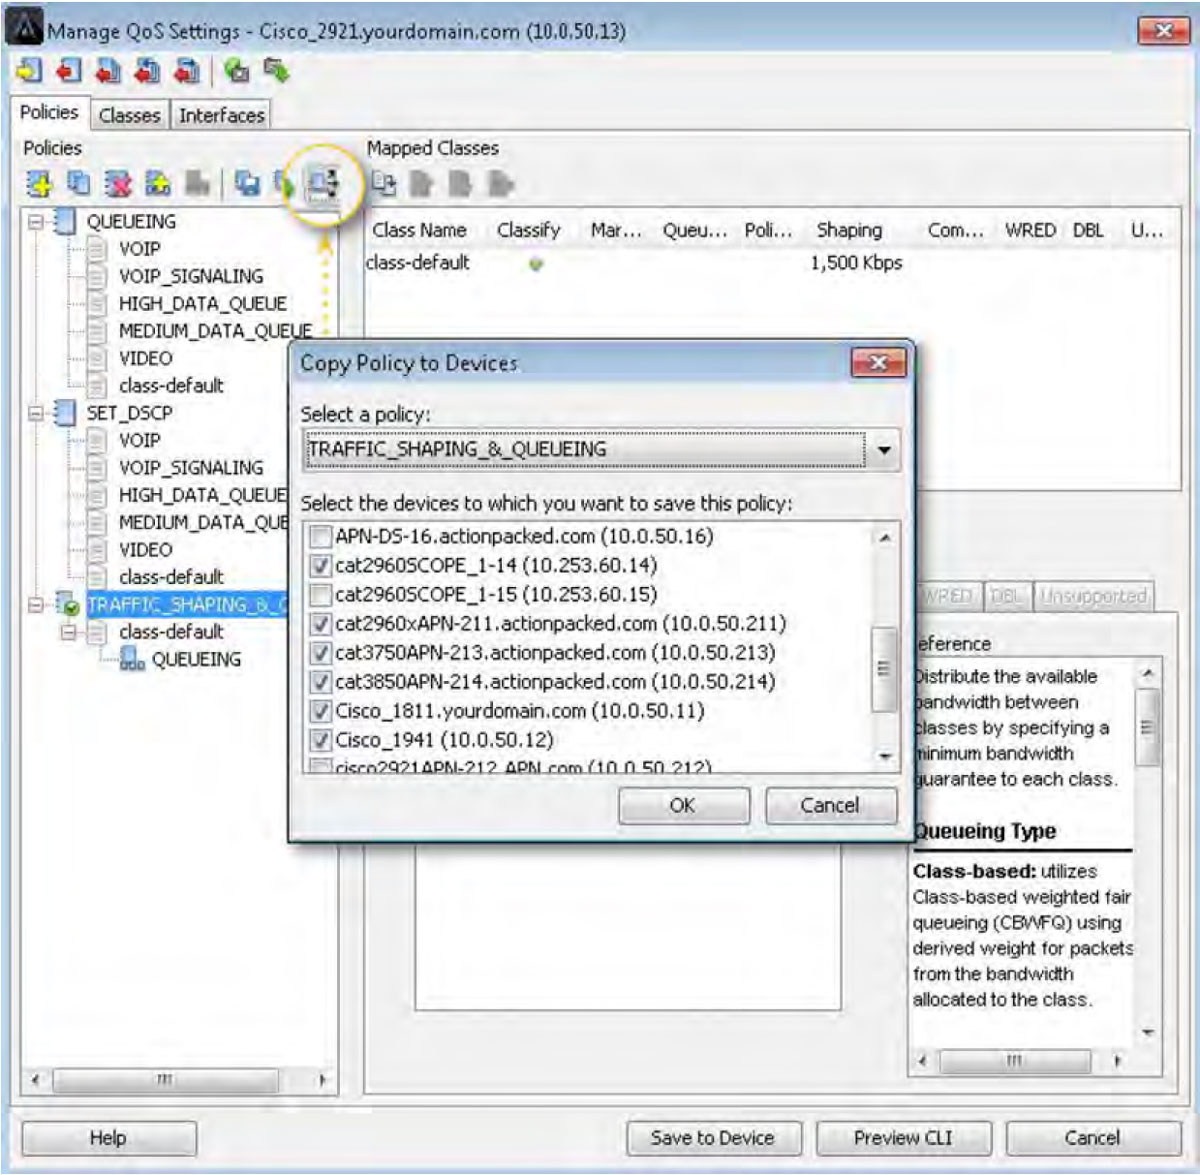
Below is the same window, but the hierarchical QoS policy TRAFFC_SHAPING_&_QUEUEING is highlighted. If an engineer wants to deploy this policy to the rest of the network, he will select the Copy Policy to Devices button and use the pop-up window to choose and push this policy to the rest of the enterprise. This feature ensures that uniform and consistent policies are deployed throughout the environment.
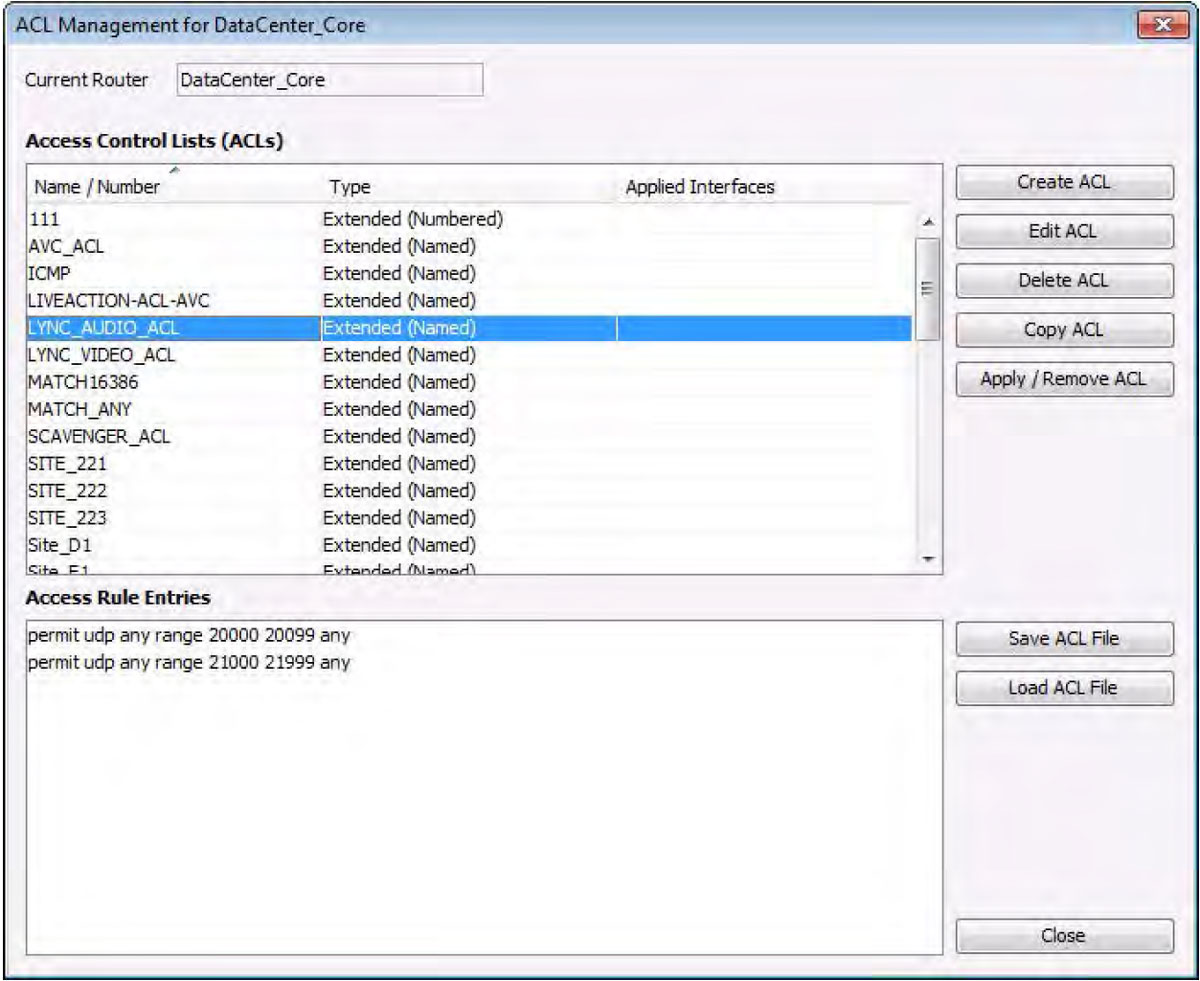
LiveNX also has built-in ACL management capabilities that give administrators a GUI to configure and push access – lists to the devices in the enterprise. This feature allows engineers to centrally manage and deploy ACLs.
The following diagram shows the ACLs LiveNX discovered on a device.
With LiveNX access-lists can be:
- Created from scratch
- If already in place, discovered automatic and edited
- Created or edited using NetFlow data
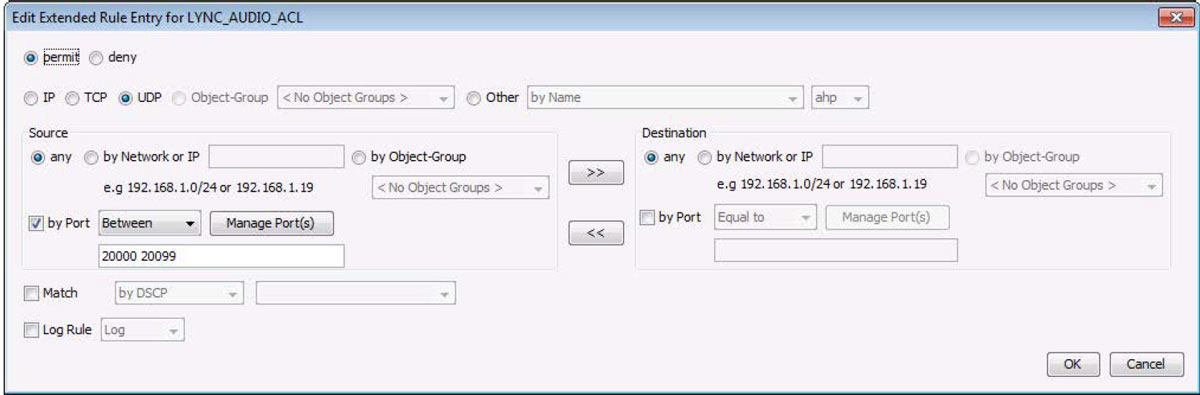
The following diagram shows how one can create and edit individual lines (ACEs) within an ACL.
In this example, all UDP traffic with a source port in the range of 20000 – 20099 is permitted.
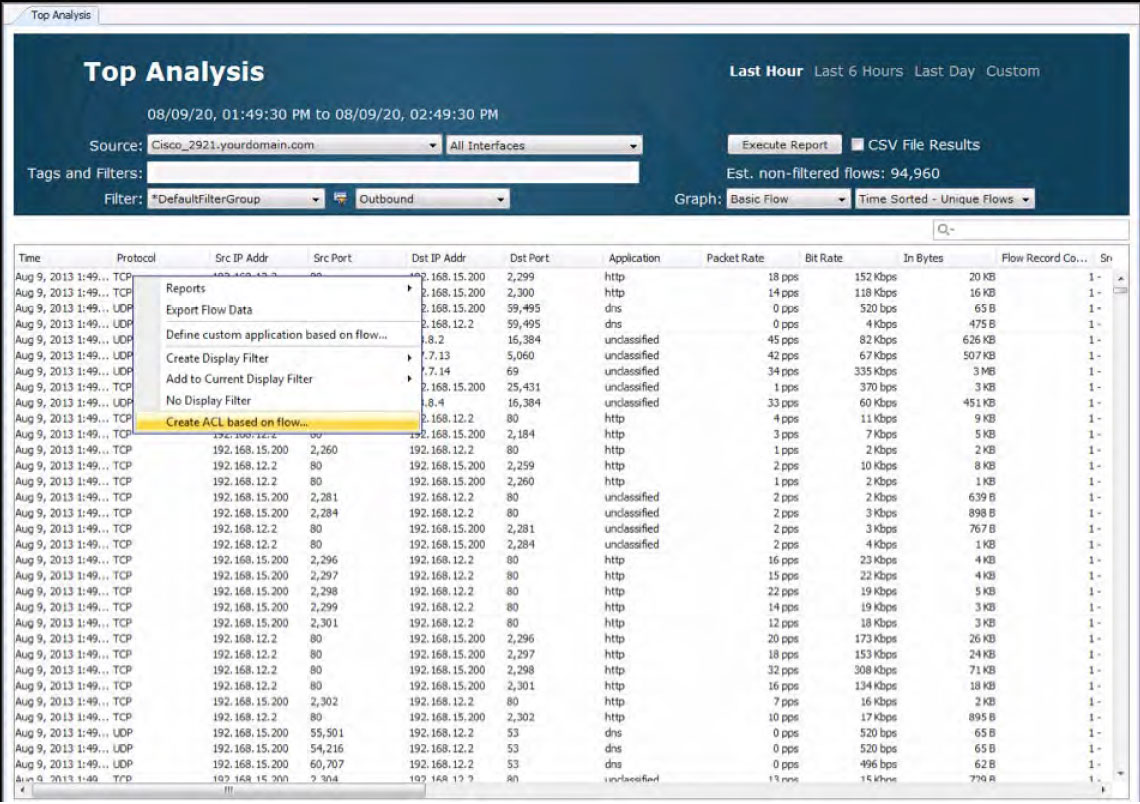
LiveNX can create ACLs based on the NetFlow data it collects. This can be accomplished from both real-time and historical report views.
QoS Monitoring & Analysis
When implementing Cisco QoS, there are QoS statistics available in IOS to help you understand how well policies are working and when they need adjustments. However, it’s difficult to use these statistics in a meaningful manner when using the Command Line Interface (CLI). Having a software tool that supports comprehensive real-time polling and historical reporting of QoS performance is critical.
Key features should include:
- CBQoS and NBAR MIB support
- Interface graphs for before and after QoS on input, output, or both
- Statistics by Class and Class Drops and Interface Drops. This information can also be useful when troubleshooting network latency issues resulting from application malfunctions or virus outbreaks.
- NBAR application statistics
- Historical graphs with zoom and report generation
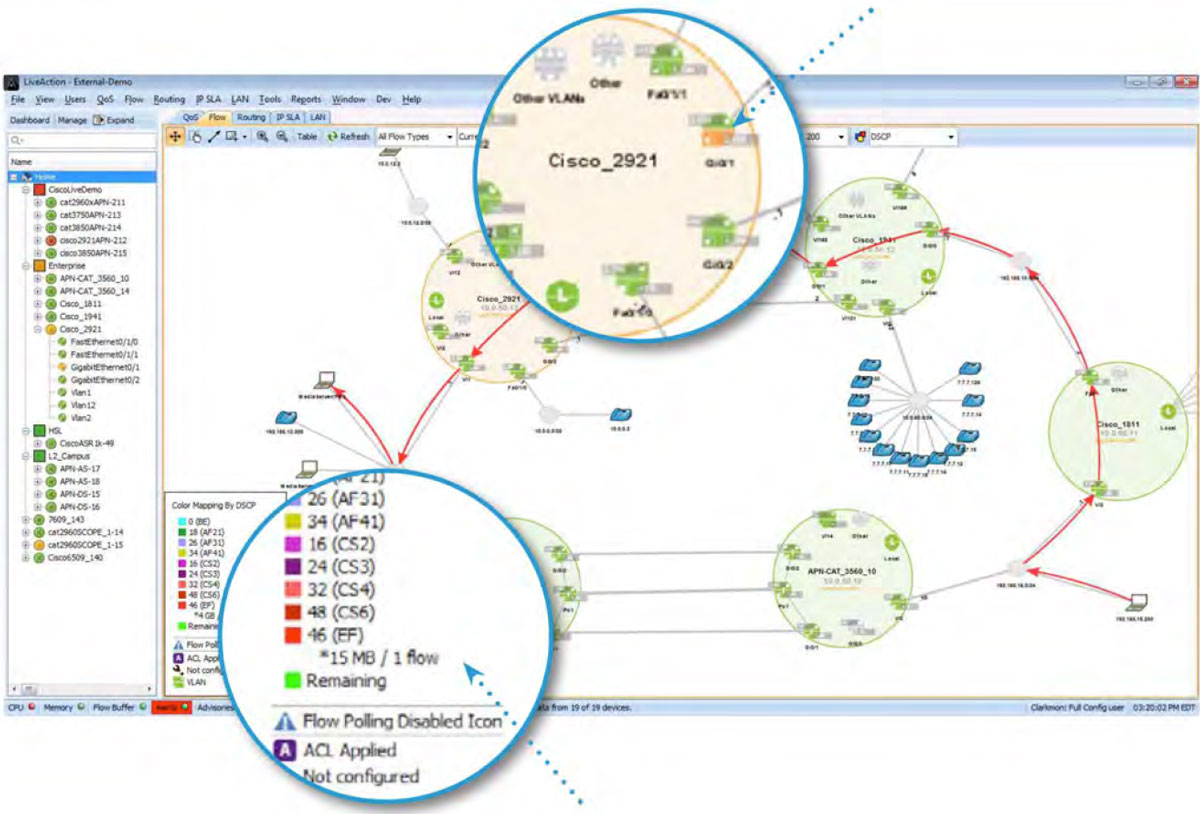
Implementation and troubleshooting are easier with system-wide flow visualization. End-to-end awareness of the traffic flowing across the network allows you to identify points of congestion, incorrectly configured services, and invalid traffic.
Since LiveNX is a NetFlow collector and mapping tool too, it can graphically display a network’s traffic patterns. In the diagram below, the red arrows represent a conversation between two endpoints. Engineers can quickly analyze the devices in the network path that are part of a conversation and determine the QoS marking set on the traffic. The red color in this example, according to the legend, is DSCP 46(EF). Any problems with DSCP markings can be quickly understood and fixed. LiveNX will also highlight any QoS performance issues in real-time.
The interface in amber, is indicating a QoS performance issue.
If the amber interface is investigated further with LiveNX’s point-and-click interface, the root of the QoS issue can be discovered.
In the example below, there are drops in the cInteractiveVideo queue.
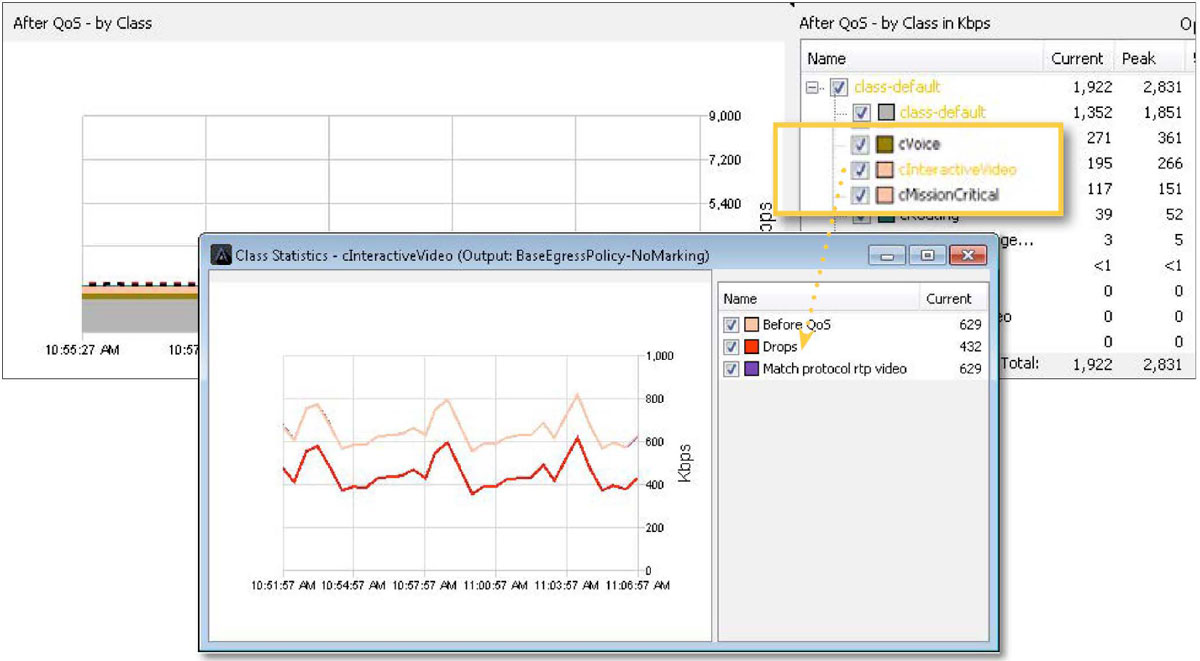
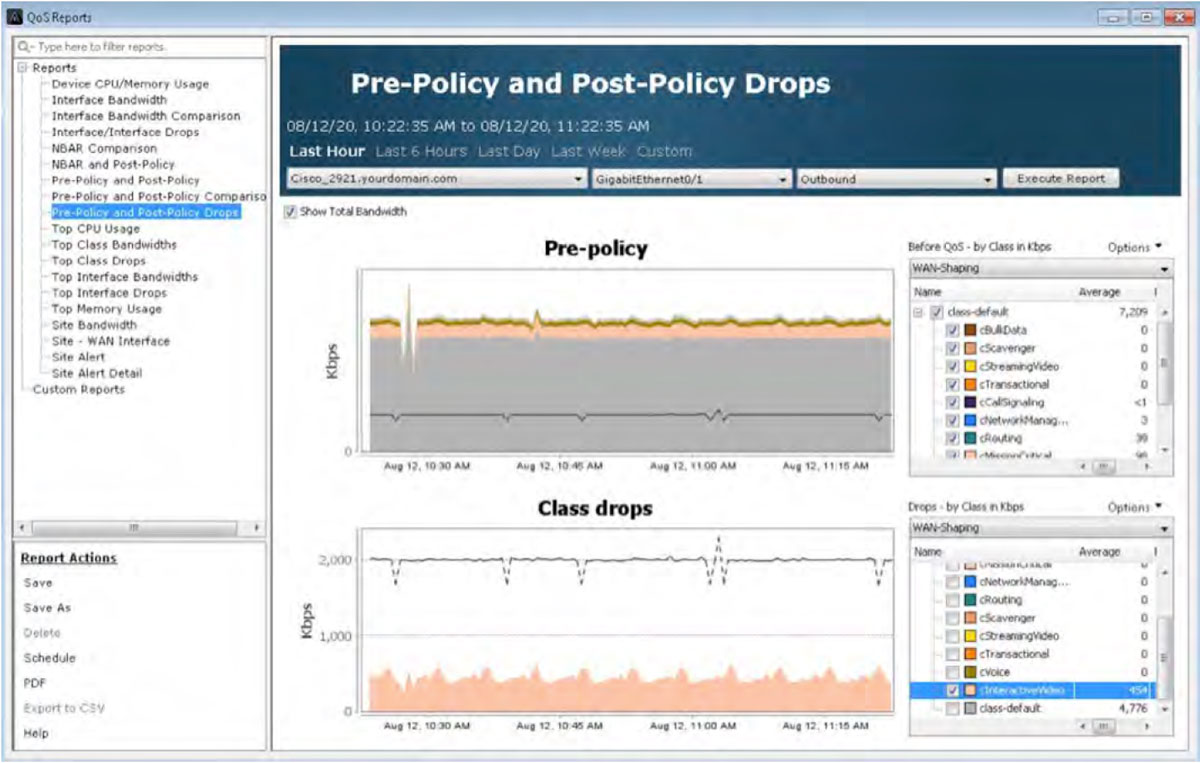
If these drops are causing business-critical applications to fail, the same reports highlighted in the Traffic Monitoring & Analysis section of this document can be used to see if changes are needed to the QoS policy. Below, in the graph title Class drops, the cInteractiveVideo drops are being viewed historically. This will help further determine any changes required to this queue’s bandwidth allocations.
Traffic Generation & Analysis
Whether experimenting in the lab or verifying performance in an operational network, it is critical to have traffic generation and analysis control. Many Cisco devices support built-in IP SLA capabilities that generate synthetic traffic and provide performance statistics from that traffic. Cisco IP SLAs generate synthetic test traffic in a continuous, reliable, and predictable manner to enable accurate measurement of network performance. Simulating network traffic with appropriate QoS markings can validate the operational performance of QoS policies and their impact on application performance.
LiveNX’s IP SLA features aids in QoS testing and monitoring via:
- Quick test wizard and advanced GUI setup
- Support for all IP SLA traffic types, including voice, HTTP, UDP
- Graphical results summary tables
- Detailed test results including latency, loss, jitter, and MOS
- Real-time, topology views of IP SLA traffic flows
LiveNX recognizes the IP SLA test currently running in a network environment. In the screenshot below, LiveNX is visually displaying the performance of various IP SLA tests. The green lines are tests that are performing well, the red lines indicate tests that are failing.
Using the Quick Test wizard, IP SLA test can be deployed easily and quickly.
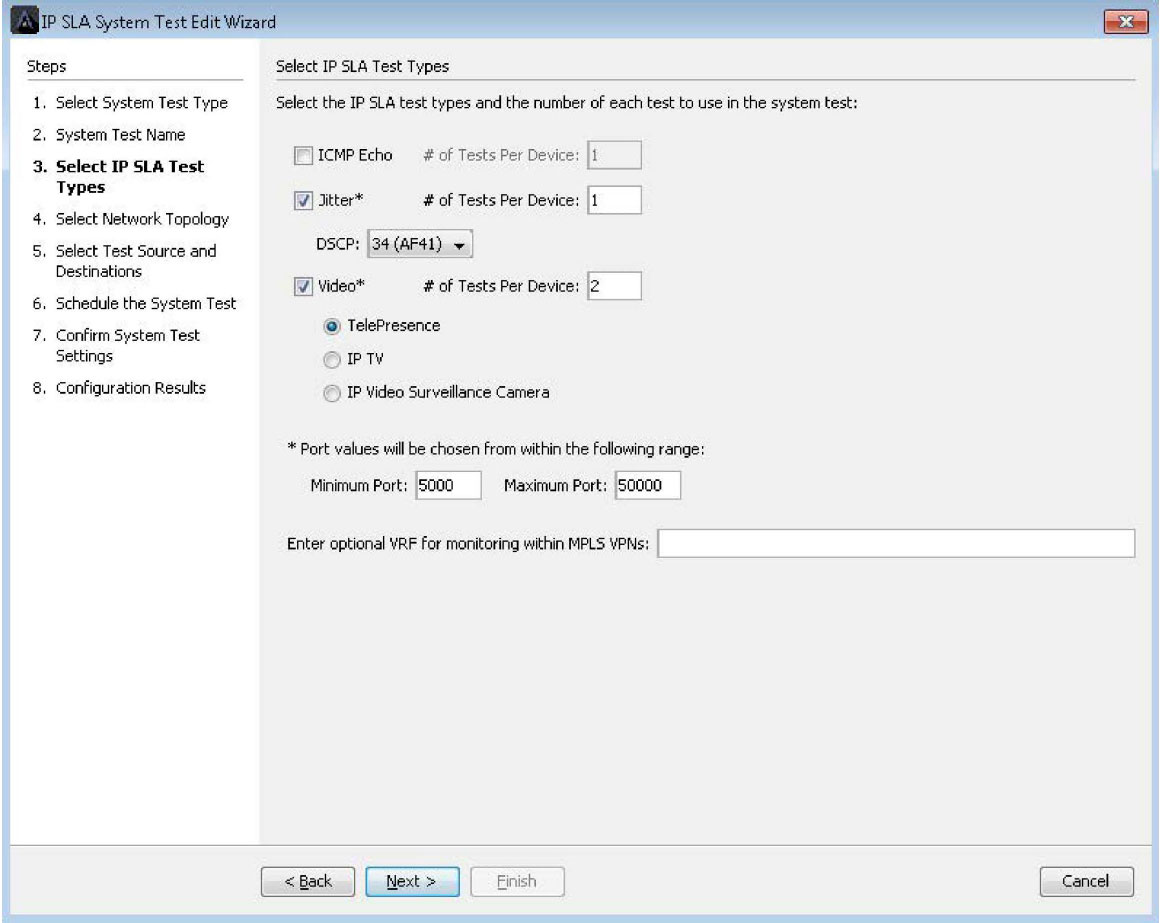
LiveNX also supports complex IP SLA Video Operation (VO) tests. These tests turn Cisco network devices into video traffic generators that simulate video over IP calls. These simulated calls are used to validate a QoS policies’ ability to handle video bandwidth requirements on the network.
The built-in wizards simplify this complex set of configuration tasks and walk engineers through easy-to-use menus to create and deploy IP SLA VO tests.
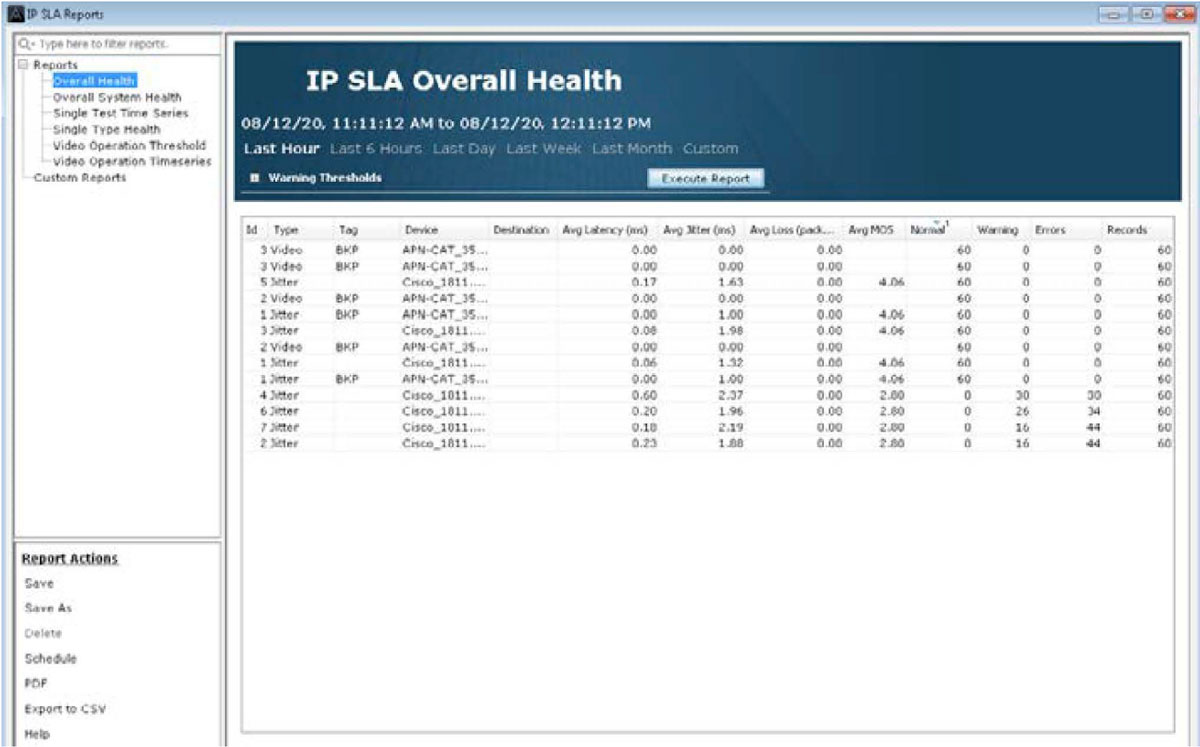
LiveNX’s IP SLA historical reports give engineers the data they need to review and analyze the long-term performance of IP SLA and IP SLA VO tests and consequently the application performance.
Appendix A: QoS Configuration Best Practices
Here are some best practices to keep in mind when designing QoS policies.
- Choose a matching and marking strategy that ensures traffic is matched and marked to protect the most critical business functions.
- When possible, follow industry standards when deploying QoS policies to align with service providers and business partners.
- Mark packets as close to the source as possible (i.e. the device itself or switch connected to the device).
- Police recreational or scavenger traffic as close to the source as possible to prevent unnecessary bandwidth usage if traffic exceeds a certain threshold.
- Enable queuing wherever congestion may occur to guarantee service optimum perforce to critical applications. This includes data center and campus LANs as well as public (DMVPN) and private (MPLS WANs.
- Provide at least 25% bandwidth for Best Effort traffic in the class default.
For real-time traffic such as voice and video, use priority queues and be sure to assign ample bandwidth. However, attempt to limit the priority queues to 33% of the overall available bandwidth to prevent starving other traffic.
- If multiple applications use PQ, use discrete priority queues for each application. ie. VOIP gets its own unique queue, video gets its own queue, etc.
- Deploy Link Efficiencies Mechanisms on WANs less than or equal to 768Kbps.
- Hierarchical traffic shaping should use a BC value of less than or equal to 1/100 of the CIR. This may be increased to 2/100 of CIR for immersive video over IP implementations. The BE value should always equal 0.
- Overprovision video over IP queues by 20% to accommodate bursts.
Appendix B: QoS Reference Tables
Table 1: Medianet DSCP Markings Recommendations
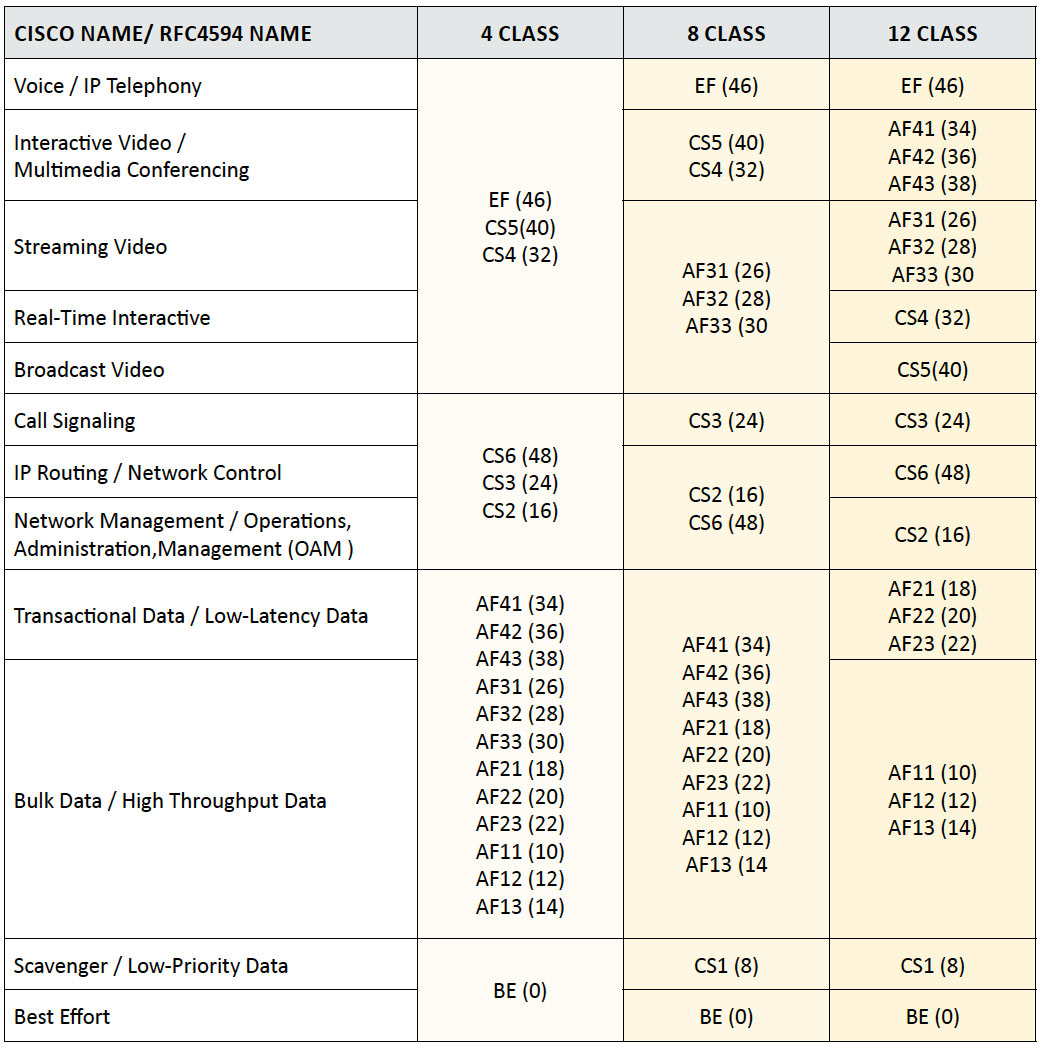
Table 2: Medianet Queue Sizing Recommendations
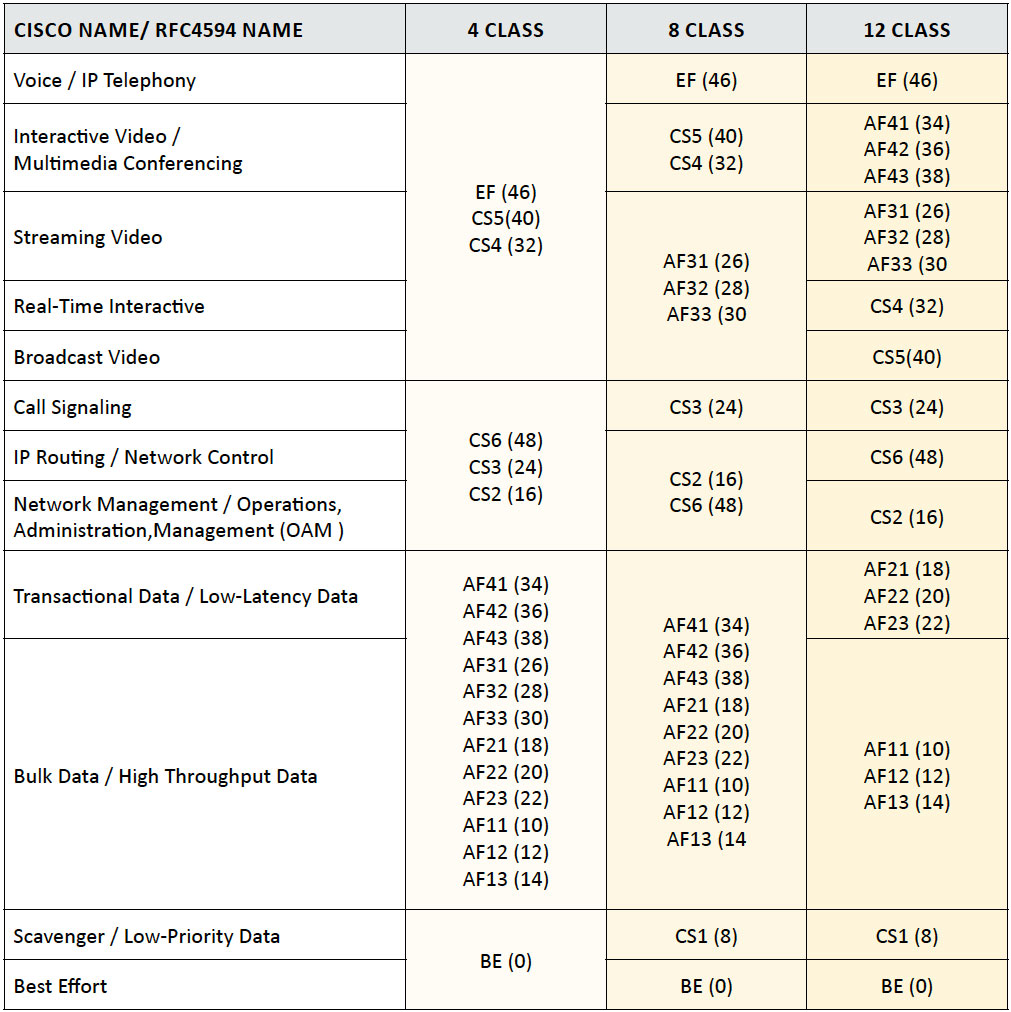
Table 3: VOIP CODEC Bandwidth
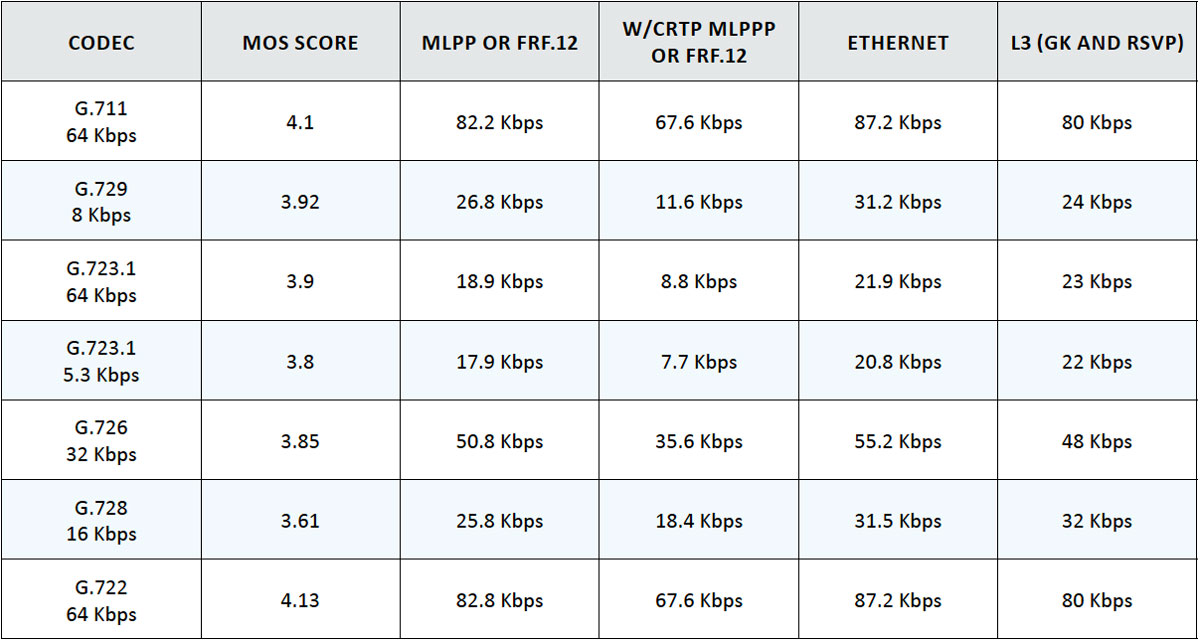
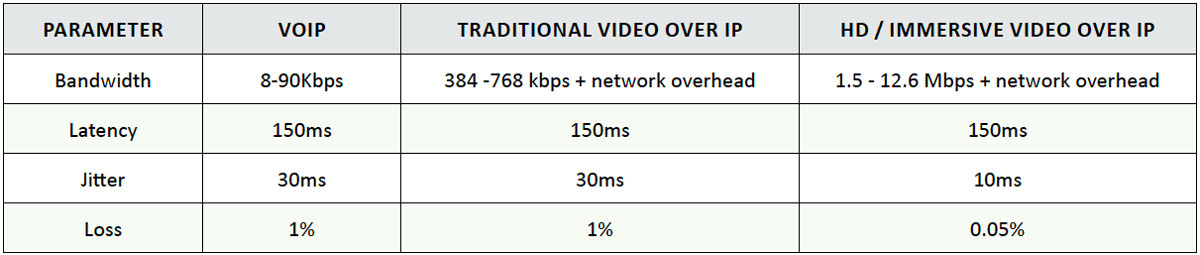
Table 4: Voice Video SLA Targets
Appendix C: Validating QoS using Performance Monitor
Design QoS policies from the high-level requirements gathered in the project planning stage.
LiveNX supports the Cisco’s Performance Monitor (PerfMon) Flexible NetFlow template. Administrators can deploy and manage PerfMon in the network infrastructure and gather application performance metrics (packet loss, jitter) for voice and video. Administrators can see how these applications are performing without the use of hardware probes by using the technology now embedded inside Cisco network equipment.
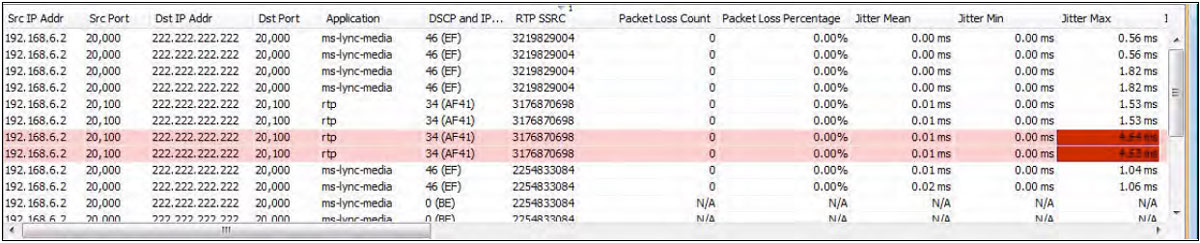
LiveNX can also display real-time PerfMon flow records. Packet loss and jitter measurements are now visible in these flow records. Both high packet loss and high jitter are performance issues that voice and video over IP cannot tolerate. In the example below, two of the flows are highlighted in pink due to an alarm being triggered by the cells in red.
In these example flows; Jitter Max measurements are triggering an alarm.
Network administrators can receive these performance alerts via Email or Syslog.
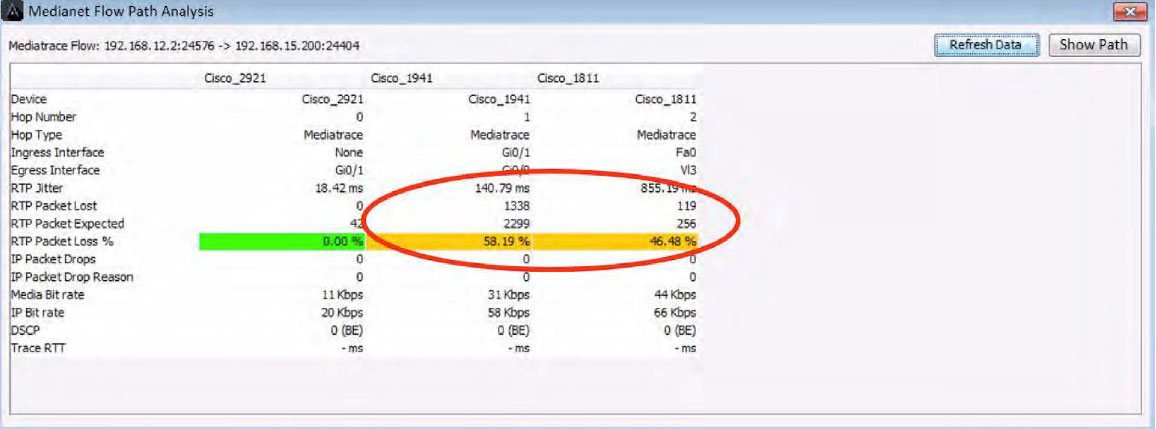
Below is a screenshot of a Flow Path Analysis table view. It is showing a voice/video call’s performance through three network devices. The center and right columns are warning of high packet loss being reported to LiveNX by their respective devices.
Below is the LiveNX network map of this same Path Analysis highlighting the performance problem visually. The arrows shown in the diagram are one discreet voice/video call through the network. The amber color indicates the call is experiencing performance issues on the center and right devices. Notice how the call passes through an interface reporting performance problems.
If the amber interface is investigated further with LiveNX’s point-and-click interface, the root cause can be discovered. In the example below, there are drops in the cInteractiveVideo queue.
Appendix D: QoS Glossary
CBQoS MIB—Class-Based QoS MIB
Cisco-specific SNMP management information base (MIB) for monitoring QoS behavior on a router. Contains QoS statistics for traffic traversing an interface configured for MQC.
CBWFQ—Class-Based Weighted Fair Queuing
MQC queuing mechanism for handling AF classified bulk and transactional traffic that is not time-, loss-, or jitter-sensitive.
Classification
Identifies traffic by protocol header fields such as IP addresses, DSCP, UDP/TCP port numbers, or higher layer protocol identification using deeper packet inspection.
Congestion Avoidance
Using WRED and packet drop mechanisms to manage traffic before times of congestion.
Header Compression
Removal of redundant header information to improve the overall throughput of the traffic (typically VoIP packets).
Link Fragmentation
The process of splitting large packets into smaller packets that are then reassembled at the end point. Used on low bandwidth links where smaller, high-priority traffic (such as VoIP) can be interleaved with fragments to avoid propagation delays.
LLQ—Low Latency Queuing
MQC queuing mechanism for handling EF classified high priority, time-, loss-, or jitter-sensitive traffic. This is also known as priority queuing.
Marking
Uses classification results and applies specific settings to protocol header fields to specify the priority or importance of the traffic.
MQC—Modular QoS Command Line Interface
A common set of functions and their commands for implementing QoS across Cisco routers.
NBAR—Network-Based Application Recognition
MQC classification mechanism using deep packet inspection to identify Layer 7 protocols such as Citrix, Skype, SCCP, SIP, eDonkey and more.
Policing
Checks classified traffic flow rates against pre-determined values and re-marks or drops packets that exceed these thresholds.
Queues
High-performance memory buffers in router where data is held to be processed. Different types of queues are typically used for realtime and non-real-time traffic. Real-time traffic queues will be low latency and low jitter.
Shaping
Checks classified traffic flow rates against pre-determined values and uses queues to buffer and prioritize packets that exceed these thresholds.
More Information
To learn more and see how LiveAction delivers unmatched network visibility, visit www.liveaction.com. Follow us on LinkedIn and Twitter to receive regular news and updates on our handbooks, product literature, and more. Download a free trial of our LiveAction software for monitoring and configuring Cisco QoS.
Cisco Qos Handbook
About LiveAction®
LiveAction provides end-to-end visibility of network and application performance from a single pane of glass. We provide enterprises with confidence that the network is meeting business objectives, full network visibility for better decisions, and reduced cost to operate the network.