Tidy Data for Network Traffic Analysis: Data Science Behind the Scenes

Contents
- Security use cases
- Detecting phishing attacks
- Uncovering data exfiltration
- Discovering lateral movement
- Revealing anomalies
- Determining DNS/IP reputation
Tidy data is a powerful tool for network traffic analysis. In this paper, Live Action Chief Data Scientist Andrew Fast, explores the topic and its cybersecurity applications.
Summary
Data Scientists estimate that they spend 80% of their time finding and cleaning data.
“Tidy” data means that the “shape” of the data matches the assumptions required by the analysis algorithms.
Common data formats for analysis include:
- Tables
- Timeseries
- Graphs
Raw network traffic is an irregular time series with complete events
- Irregular time series contain events that arrive at variable intervals
- Complex events contain multiple variables
What is Tidy Data?
Tidy data is data that has been fully prepared for input into algorithms for analysis. Each instance in the data has uniform structure with no missing data (unless allowed by the algorithm). The assumptions for each individual algorithm depends on the required “shape” of the data.
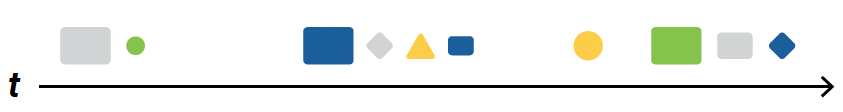
In its raw form (whether raw packets or network meta-data), network traffic is an example of an irregular time series with complex events. An irregular timeseries has variable intervals between events. Complex events contain more than one attribute.
Unfortunately, few algorithms are designed to work with irregular time series. Instead, a common strategy is to “project” the data into a simpler format by removing some of the additional complexity. Projection is a term that is used in the relational algebra underlying SQL.
Common formats for analysis include:
- Regular timeseries, single variable
- Table data (ignoring time)
- Graph data
Common Action for Tidying Data
Data Scientists spend 80% of their time tidying data
| Action | Purpose |
|---|---|
| Binning | Reduce dimensionality |
| Imputation | Fill-in missing data |
| Join | Combine data from different tables |
| Aggregation | Group instances by another variable |
| Projection | Remove variables from the data |
| Normalize | Reduce data redundancy and improve data integrity |
Timeseries Data
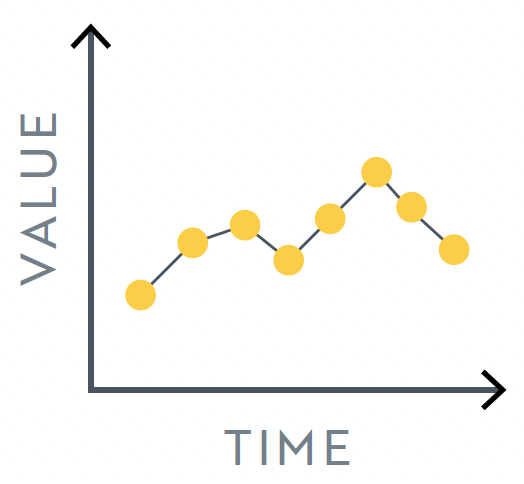
Timeseries data is the most common data type for analysis of network traffic. Typically, these analyses are created by aggregating data for a time window (e.g., events per second). This creates a data structure with a single variable occurring at fixed interval. Timeseries analysis also include techniques for accounting for seasonality and temporal trends.
Algorithms and Tasks include
- Forecasting
- Autoregressive Moving Averages (ARMA/ARIMA)
- Anomaly Detection
Security Use Cases
- Detect phishing attack using domain burst detection
- Detect exfiltration using change point detection in Producer/Consumer Ratio
Timeseries data consist of a single variable at fixed intervals.
Tabular Data
A data table is the most common format for traditional data science analysis. Commonly found in either a relational database or Excel spreadsheet, a table is characterized by multiple variables combined in a row representing a single event or entity. Tables are created using data normalization, joining tables, and projection.
Algorithms and Tasks include
- Classification (Supervised Learning)
- Clustering (Unsupervised Learning)
- Outlier Detection (Unsupervised Learning)
Security Use Cases
- Detection of Domain Generation Algorithms using classification
- Detect anomalous behavior using unsupervised learning
Tabular data can be easily stored in spreadsheets or database tables.

Graph Data
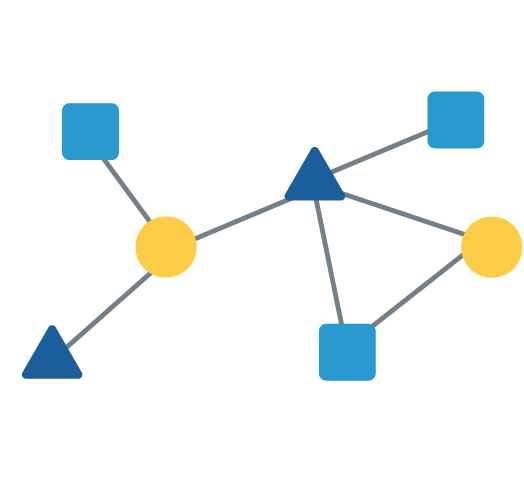
Representing data as a graph is natural for network data. A graph is a general data structure containing nodes, representing entities in the network, and edges, representing relationships between entities. More advanced graph types support the addition of one or more attributes on both nodes and edges. This rich representation requires specialized algorithms to process effectively.
Algorithms and Tasks include
- Community Detection
- Collective Classification
- Anomalous Link Detection
Security Use Cases
- Determine DNS/IP reputation based on network associations
- Detect lateral movement with anomalous link detection
Graph data represents the relationships between network entities. Multi-attributed graphs are often projected to simpler data formats for analysis.
Download White Paper
Tidy Data for Network Traffic Analysis: Data Science Behind the Scenes
About LiveAction®
LiveAction provides end-to-end visibility of network and application performance from a single pane of glass. We provide enterprises with confidence that the network is meeting business objectives, full network visibility for better decisions, and reduced cost to operate the network.