Five Criteria for Choosing an Enterprise Network Performance Management (NPM) Solution

Contents
IT teams can provide strategic value to the business by adopting a modern approach to network management. This includes selecting an NPM solution capable of meeting both IT and business requirements. To select an effective network performance management (NPM) solution, enterprises must push beyond traditional vendor selection criteria.
This report will cover each of these five criteria in more detail, highlighting specific questions and best practices to consider when evaluating a new NPM solution:
- Comprehensive end-to-end network visibility and performance management
- Network traffic analysis
- NetFlow, and analytics to monitor real-time
- AIOps, analytics, and visualizations
- Enable high-performance digital user experiences
If your organization is experiencing challenges and a lack of confidence regarding NPM solutions, download our Solution Overview to learn how LiveAction meets all five criteria and is among the most robust NPM solutions on the market today.
The Criteria
IT professionals have long relied on network performance management (NPM) tools to help identify and reduce instances of outages, traffic bottlenecks, and network performance issues. NPMs have evolved into a critical part of an organization’s strategy for managing the digital user experience for internal users, company partners, and customers.
While many enterprises have embraced digital transformation for customer-facing technologies, they have yet to modernize the underlying architecture that powers these digital front-end solutions. This includes using legacy and non-scalable NPM tools. These tools have inadequate support for complex hybrid environments, lack machine learning capability, and have limited ability to correlate performance across all computing layers.
IT teams can provide strategic value to the business by adopting a modern approach to network management. This includes selecting an NPM solution capable of meeting both IT and business requirements. To select an effective network performance management (NPM) solution, enterprises must push beyond traditional vendor selection criteria. Before deciding on your NPM platform, consider these five criteria.
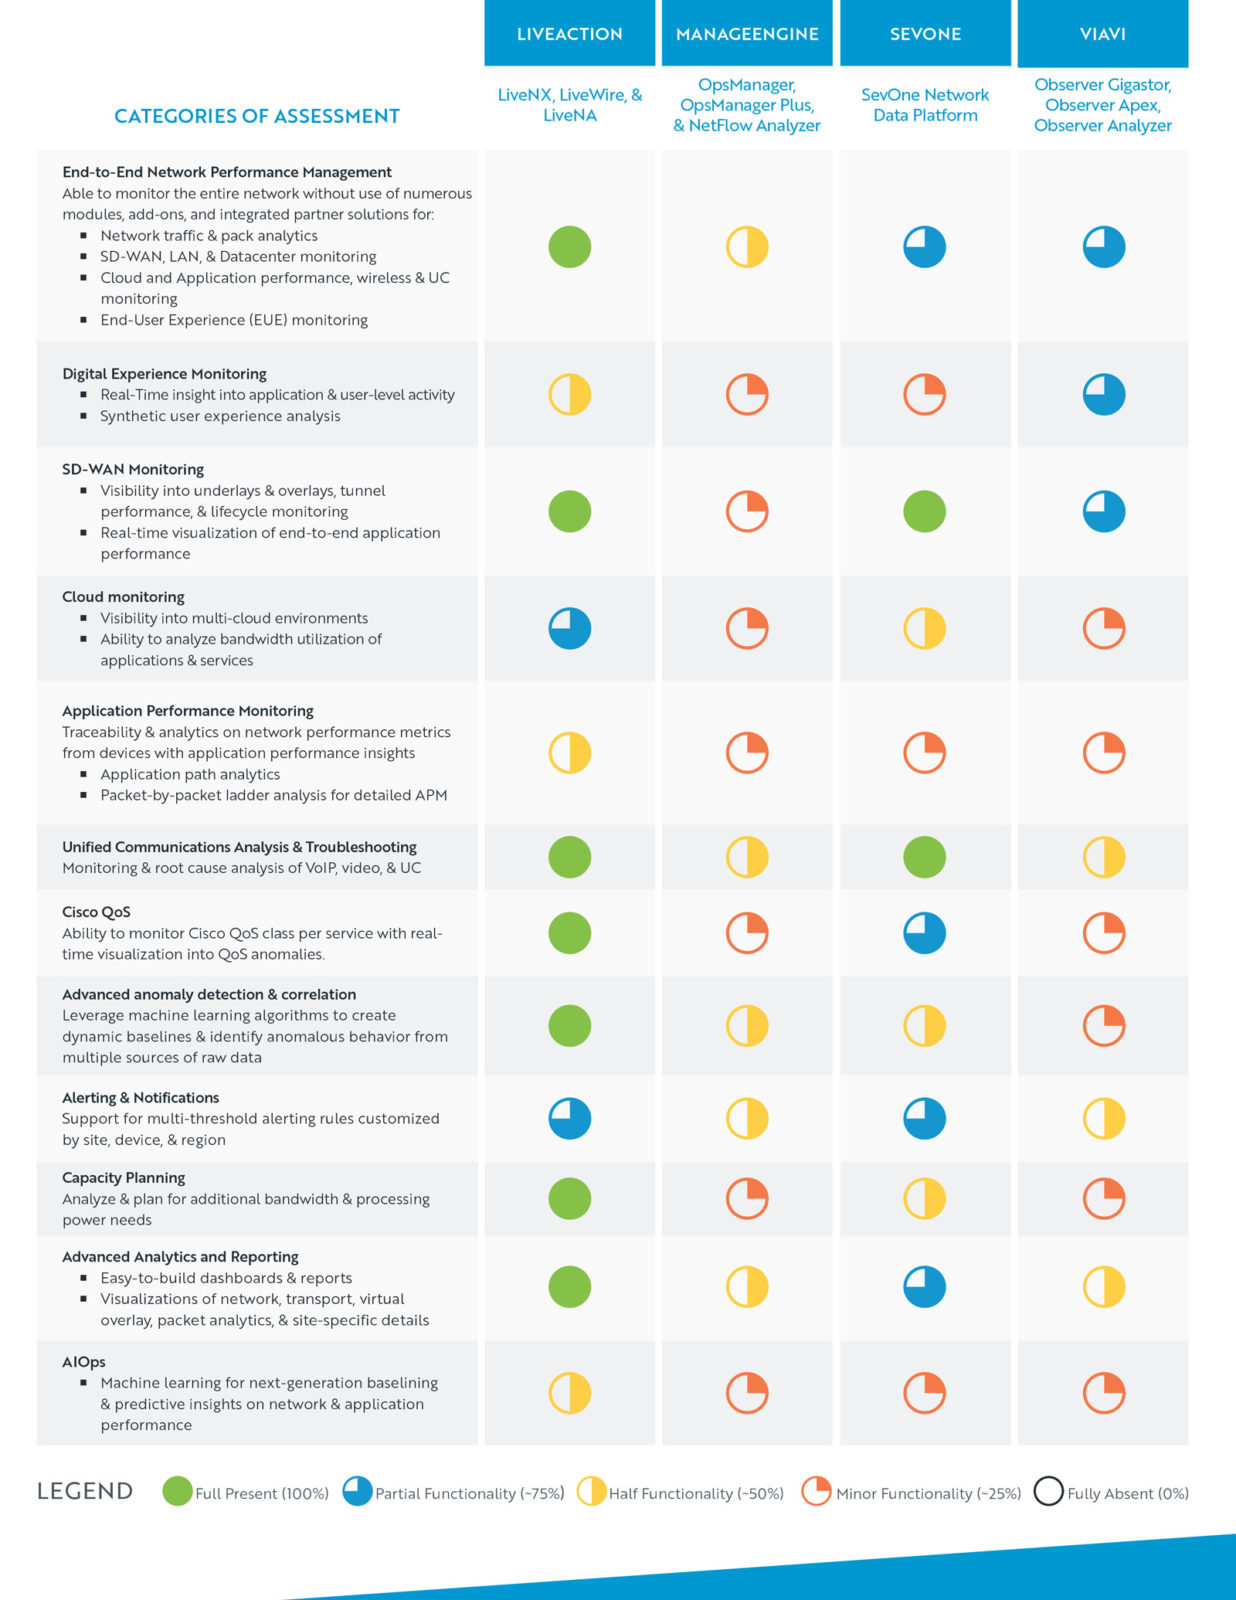
We evaluate LiveAction, ManageEngine, Viavi, and SevOne on a rubric based on these five critical criteria:
1 – Comprehensive end-to-end network visibility and performance management
Is the solution able to monitor the entire network, including SD-WAN & WAN, LAN, public, hybrid, and multi-cloud environments, wireless, campus, and data center? Or is the solution only able to support specific categories and environments?
2 – Network traffic analysis
Does the platform have deep packet capture, NetFlow, and analytics to monitor real-time network traffic and application performance?
3 – Application performance and visibility monitoring
Can the platform analyze and correlate data from network devices, applications, and cloud environments to maximize application performance?
4 – AIOps, analytics, and visualizations
Does the solution incorporate AIOps for advanced anomaly detection and correlation? Does the solution offer analytic visualizations that enable rapid root cause analysis and a deeper understanding of network utilization?
5 – Enable high-performance digital user experiences
Does the solution support monitoring the complete digital user experience, including synthetic monitoring techniques that can test the health and performance of user engagement paths?
This report will cover each of these five criteria in more detail, highlighting specific questions and best practices to consider when evaluating a new NPM solution.
What can the vendor’s solution do?
Question One: Is the solution able to monitor and manage the entire network or only specific categories or environments?
Does the platform manage the entire digital experience and monitor and manage the cloud, wireless, SD-WAN & WAN, LAN, application, campus, and data center environments?
Modern IT infrastructure is increasingly becoming more complex and specialized to the bespoke needs of the organization. While local technology stacks have increased density, they have also expanded to incorporate multiple different vendors, technologies, and environments. The “hybrid networking” is now a common term spoken within enterprise IT organizations. Enterprises have a significant challenge not only maintaining comprehensive visibility in dynamic, hybrid environments but also ensuring expected performance.
For example, suppose a single component is suffering from performance issues. The effects can be wide-reaching, and the catalyst of the resulting problems can be challenging to pinpoint across such a broad range of moving parts. This is why modern NPM solutions must be able to monitor these individual components and environments in a single solution and correlate collected performance data to quickly identify root causes and understand their potential effects on individual environments and the overall digital experience.
An effective modern NPM solution needs to collect and correlate performance data from the entire network, often from complex hybrid environments. This includes monitoring all types of network devices used, wireless components, SD-WAN & WAN, LAN, cloud environments, customer and enterprise applications, VoIP devices, and datacenters. In addition, the solution needs to collect and analyze data not only for root cause and performance analytics but also for proactive health metrics. Key health analytics include top network users, availability, common traffic patterns that contribute to performance issues, application jitter, latency, and loss. Finally, NPM solutions should automatically create baseline and trending metrics to ensure that capacity issues do not contribute to downtime or performance issues.
Why this has value to you:
Using a consolidated NPM platform that ingests all data from the cloud, the core, and the WAN edge provides NetOps with improved data accuracy and faster response times.
What does the vendor’s platform support?
Question Two: Does the vendor’s platform support granular, correlated network traffic insights?
Does the vendor’s platform have deep packet capture, IPFIX, NetFlow, and analytics to monitor real-time network traffic and correlate traffic across the network?
Whether users are accessing applications hosted internally or in the cloud, an NPM tool should correlate traffic data in real-time with application performance and end-user experience. This boosts the efficiency of network operations teams. Rather than analyzing every fault that the monitoring tool detects, engineers can use targeted alerting to prioritize focus on problems that affect end users. This segmentation of alerting can also reduce false positives and alarm storms.
The platform you choose should deliver insights into application performance and end-user experience through deep real-time processing and packet-by-packet analysis. A tool should present network transactions with performance indicators, including supporting views into complex, multi-tiered applications. These transactions should be correlated with end-user sessions and applications. Ideally, the solution will show the engineer how critical applications perform on the network and how users experience individual sessions. This visibility should enable network operations teams to quickly isolate problems, mainly if the tool combines insight into the end-user experience with awareness of the network domain.
Why this has value to you:
Instead of spending time tying disparate data results together, a modern NPM can utilize Artificial Intelligence (AI) and Machine Learning (ML) to intelligently correlate and categorize the findings for you. Skip the “gathering and fact-finding” step and jump right into action.
What does the vendor’s solution enable?
Question Three: Does the solution enable complete application performance monitoring and visibility?
Does the solution analyze and correlate data from network devices, applications, and cloud environments in a single platform? Is application performance automatically analyzed for performance optimization?
For most IT organizations, application performance optimization drives most of their network monitoring and management strategies. Today’s applications must operate with high performance, meeting the customer demand for a seamless digital experience. Necessarily, network managers must have NPM solutions with integrated application intelligence.
NPM solutions need to gather network performance metrics from infrastructure devices, including routers, firewalls, load balancers, switches, and application performance enriched flow data, to create a comprehensive application-impact analysis. Any NPM solution being evaluated should support integrated application visualizations, including application path analytics. NPM solutions should send alerts during application performance issues caused by network-device failures.
The NPM solution should be able to:
- Understand application traffic with complete visibility of protocol and application type.
- Troubleshoot applications deployed in the data center, public cloud, SaaS, or hybrid environments.
- Visualize packet-by-packet to perform detailed application-performance analysis.
- Analyze packet data to identify application errors in packet payloads.
- Pinpoint the source of latency as a network versus the application root cause.
- Provide application usage and performance data at the site level.
- Report top application performance, highlighting average application and network delays.
Why this has value to you:
Graphic visuals are processed 60,000 x faster than text and are easier to remember. Powerful, clean graphic displays of united network and application data allow NetOps to perform at their greatest efficiency.
Does the vendor’s solution incorporate AIOps?
Question Four: Does the solution incorporate AIOps to enable advanced anomaly detection and correlation?
Does the solution incorporate machine learning for advanced anomaly detection and correlation across all network layers and provide visualizations that allow rapid root cause analysis and a deeper understanding of network utilization?
Since scale-related performance is critical, modern NPM solutions should incorporate ML techniques to enable the platform to continuously learn and apply knowledge based on data trends. This includes creating dynamic baselines and identifying anomalous behavior from multiple raw data sources. In addition, ML algorithms can support critical performance corrections. This includes determining which voice traffic to prioritize, when to throttle bandwidth, and whether to block a user’s access.
Why this has value to you:
AIOps can be applied to large-scale data collection for scalable fault identification. It can ingest logs from anywhere in the WAN to make recommendations for better decisions. It can evaluate what is normal or abnormal behavior and find the relationship between the application’s performance problem and the storage system associated with it. Some AIOps tools could even go beyond recommendations trigger actions without human intervention, for example: beginning a disk rebuild when there is an impending storage failure.
What digital experiences does the solution enable?
Question Five: Does the solution enable high-performance digital experiences across the entire network?
Does the solution support the analysis and optimization of the digital experience across applications, network devices, public, hybrid and multi-cloud environments, SD-WAN, and VoIP? Does the solution incorporate synthetic monitoring to test the health and performance of common user engagement paths?
Understanding the user experience is critical to optimization. Organizations evaluating NPM solutions should ensure that the solution supports end-to-end performance monitoring of data and analytics from different domains in a common user interface with KPIs, insights, and predictive analytics for optimization.
Vendors that support IPSLA and agent-based synthetic monitoring solutions can test the health and performance of the application traffic paths. Solutions that support deep packet inspection (DPI) into application traffic can correlate and analyze network data with application performance and provide improved user experience.
Why this has value to you:
When end-users can engage in the environment with positive outcomes, there are no obstacles creating friction between their experience and the business’s desired outcome – whether that be sales, communications, or greater employee efficiency.
Conclusions and Findings
To determine the ranking of the four vendors’ NPM solutions based on the selection criteria, Apprize 360 interviewed current and former customers of the LiveAction, SevOne, ManageEngine, and Viavi platforms. The interviewees were asked to rate each solution according to the five outlined criteria. The interviews and assessment focus on the abilities of each solution to fulfill the five selection criteria.
Apprize360’s assessment concluded that LiveAction’s LiveNX, LiveWire, and LiveNA solutions best meet all five criteria and are among the most robust NPM solutions on the market today.

01 Complete NPM solution
LiveAction gathers real-time data from multi-vendor network elements to monitor VoIP and video, SD-WAN, cloud, application, and data center performance. Customers reported that LiveAction allowed them to visualize the impact of network issues in real time. LiveAction’s LiveNA platform automatically identifies anomalies and highlights the most critical ones to address. LiveAction’s LiveNX correlates multiple data sets across the network for real-time visualization of end-to-end application and network performance flows, quickly identifying performance metrics and highlighting path and routing changes to enable rapid diagnosis and correction. LiveAction’s time-based analysis of network performance states that it allows IT teams to report any deviations in performance because of the addition of new computing resources, devices, and IT environments. Overall, customers reported that LiveAction supported their need for quick troubleshooting of multi-domain performance issues and proactively optimizing network performance.
02 Granular traffic and packet analysis
With flow and packet-level analysis, LiveAction allows NetOps to quickly isolate problem areas and offer a rapid response to any high-severity incidents.
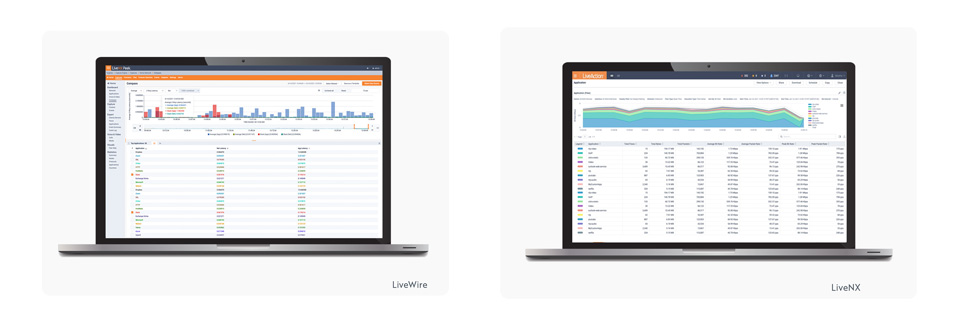
- LiveWire: LiveAction’s LiveWire includes detailed network traffic analytics that support real-time troubleshooting, detection of anomalous behavior, and analysis of emerging performance issues. LiveWire starts with packet data and provides a unique and extended set of flow-based monitoring data called LiveFlow. LiveFlow is extended IPFIX data exported to LiveNX, where the complete network topology is visualized. LiveNX stores the monitoring data for both long-term reporting and real-time alerting. Regardless of the depth of LiveFlow data, there are instances when packets are required for detailed root cause analysis. Since LiveWire also stores all packets while simultaneously generating LiveFlow, issues identified on LiveNX dashboards can easily be analyzed in detail, down to the packet level, by clicking on an alert or a flow that needs further investigation.
- LiveNX: LiveNX’s network traffic analytics provide complete visibility across the network through ingesting packet data, flow data, Wi-Fi data, and device data. With LiveNX’s deep “packet-by-packet” analysis, users can conduct real-time troubleshooting across the network, especially for VoIP and video root cause analysis. LiveNX ingests flow data, including NetFlow, IPFIX, sFlow, jFlow, and data generated by LiveWire, for visibility into the network performance across multi-vendor, multi-domain, and multi-cloud networked environments. LiveNX leverages Wi-Fi and device data to quickly troubleshoot and resolve network issues across specific devices. LiveNX also features rapid incident response workflow with Alert notification or predictive insight to identify the event for remediation. Within LiveNX’s Engineering Console, NetOps can more easily isolate the issue with the visual analytics presented as topology, site, or device views. LiveNX shows the time stamp from the Alert and the problem isolation from the Flow data. Should additional analysis be necessary, the NetOps team can quickly cross launch Omnipeek for deep packet analysis for root cause analysis.
03 Application visibility and performance monitoring
LiveAction is able to gain a deep understanding of application traffic with its complete visibility into protocol and application types, including video, voice, instant messaging, and file transfer. This enables users to rapidly troubleshoot applications deployed in the data center, public cloud, SaaS, and hybrid network. This also allows users to understand how a network is being utilized, how applications are performing, and which sanctioned or unsanctioned applications are being used. Using LiveAction’s Application Path Analytics (APA) feature, users can identify precisely where application performance issues originate and correlate the impact of those issues on other applications and network devices.
04 AIOps, analytics, and visualizations
LiveNA is LiveAction’s AIOps platform, which applies machine learning and heuristics to network datasets to enable advanced anomaly detection and predictive analytics that deepen network understanding. LiveNA uses proprietary machine learning algorithms to establish baselines for applications and the network to detect deviations from the baseline, anomalies, and correlate events. LiveAction’s patented visualization engine is another differentiator that provides visual insights into the entire network, including visual packet analysis, visual path analytics, transport view, virtual overlay view, and site-specific details.
05 Digital Experience
LiveNX allows the enterprise to gain real-time and continuous insight into user activity across applications, network layers, and other infrastructure environments. User Experience is a software module available with the LiveNX Performance and Analytics platform that provides instant visibility of site health, network devices, application usage, and application performance. LiveNX User Experience proactively monitors the end-user experience by performing periodic active tests to collect data about your network and application performance. As a result, you can gain insight into the availability and performance of any web-based application anywhere to address issues before they impact users. The module also supports correlating end-user experience and network information through LiveNX Application-aware Network Performance Monitoring integration. Customers report the ability to drill down from the module to examine network conditions, including bandwidth utilization, link errors, QoS metrics, and applications that are competing for the bandwidth.
Categories of Assessment
Download the White Paper
About LiveAction®
LiveAction provides end-to-end visibility of network and application performance from a single pane of glass. We provide enterprises with confidence that the network is meeting business objectives, full network visibility for better decisions, and reduced cost to operate the network.