
Knowing whether your network is healthy or not is important, especially if you are responsible for it. And performing a network health assessment proactively is smart, so you will know if it is not healthy before users complain. And if it is not healthy, it is important to know why so you know where to look and fix it.
Response Time
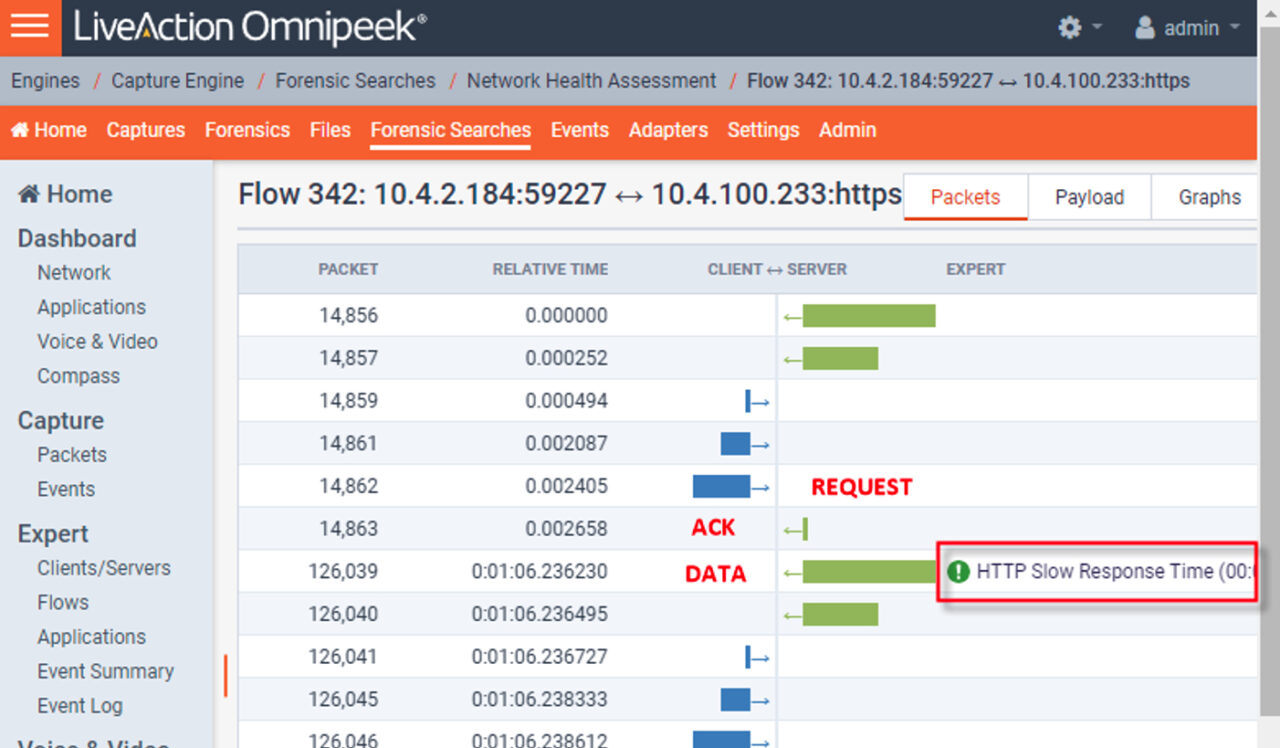
There are many signs of a healthy network, and one of the most important is low response times. High or long response times is a sign of an unhealthy network. Response times can be determined by capturing the traffic and measuring the time it takes for a client request to return a response from the server. There are two types of responses. One is a network response, or ACK, and the other is the application response, or data from the application. When a request goes out, the server will respond with an ACK as soon as it receives the request. The application response will be returned when the application is done processing the request and returns some data. An example of these transactions is shown below in the LiveWire Flow Visualizer. On the right, LiveWire has flagged the transaction as an HTTP Slow Response Time.
Before looking at an individual flow for latency, LiveWire can be used to perform a network health assessment that can be performed at a higher level across a range of time. These measurements will help you determine if there is a performance problem on your network, and whether the network or the application is the problem. It is important that these tests are performed with real data on your network.
Performing a Network Health Assessment with LiveWire
LiveWire is software that can be installed on virtually any computer that is connected to the network, whether it is on-prem or in the cloud. LiveWire captures network traffic, and performs many different types of analysis. One of these is network and application latency, which is the basis for this high level network health assessment.
Instructions
To perform a network health assessment using LiveWire, first download the LiveWire Trial. You can find our installation guide here.
Capture
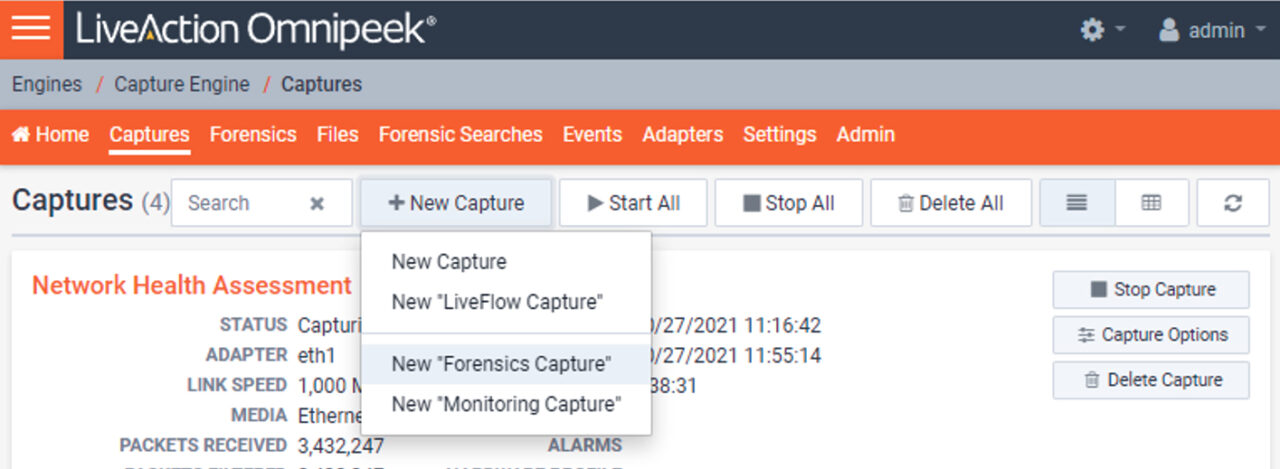
Once LiveWire is installed and running, create a capture on the interface where the traffic of interest is.
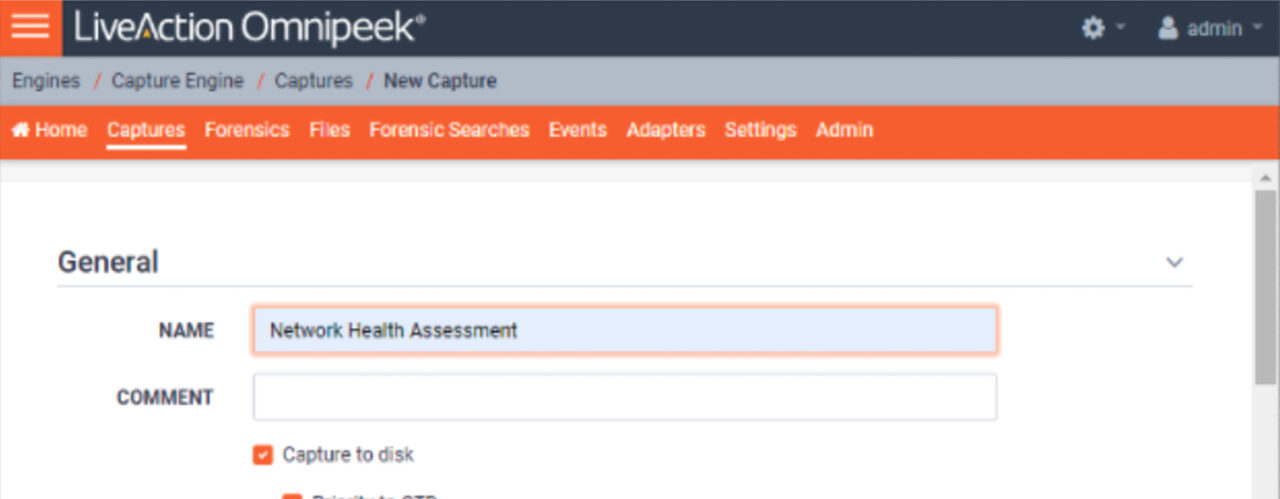
The capture options should have CTD enabled, which is the default, in order to capture to disk. Also, select the right adapter.
Once the capture has been started, let it run for a little while to get a good sample of traffic.
Go to the Forensics View and select a reasonable range of time, which would be less than a million packets or so. More packets are fine, but the more packets in the result, the longer the forensic analysis will take.
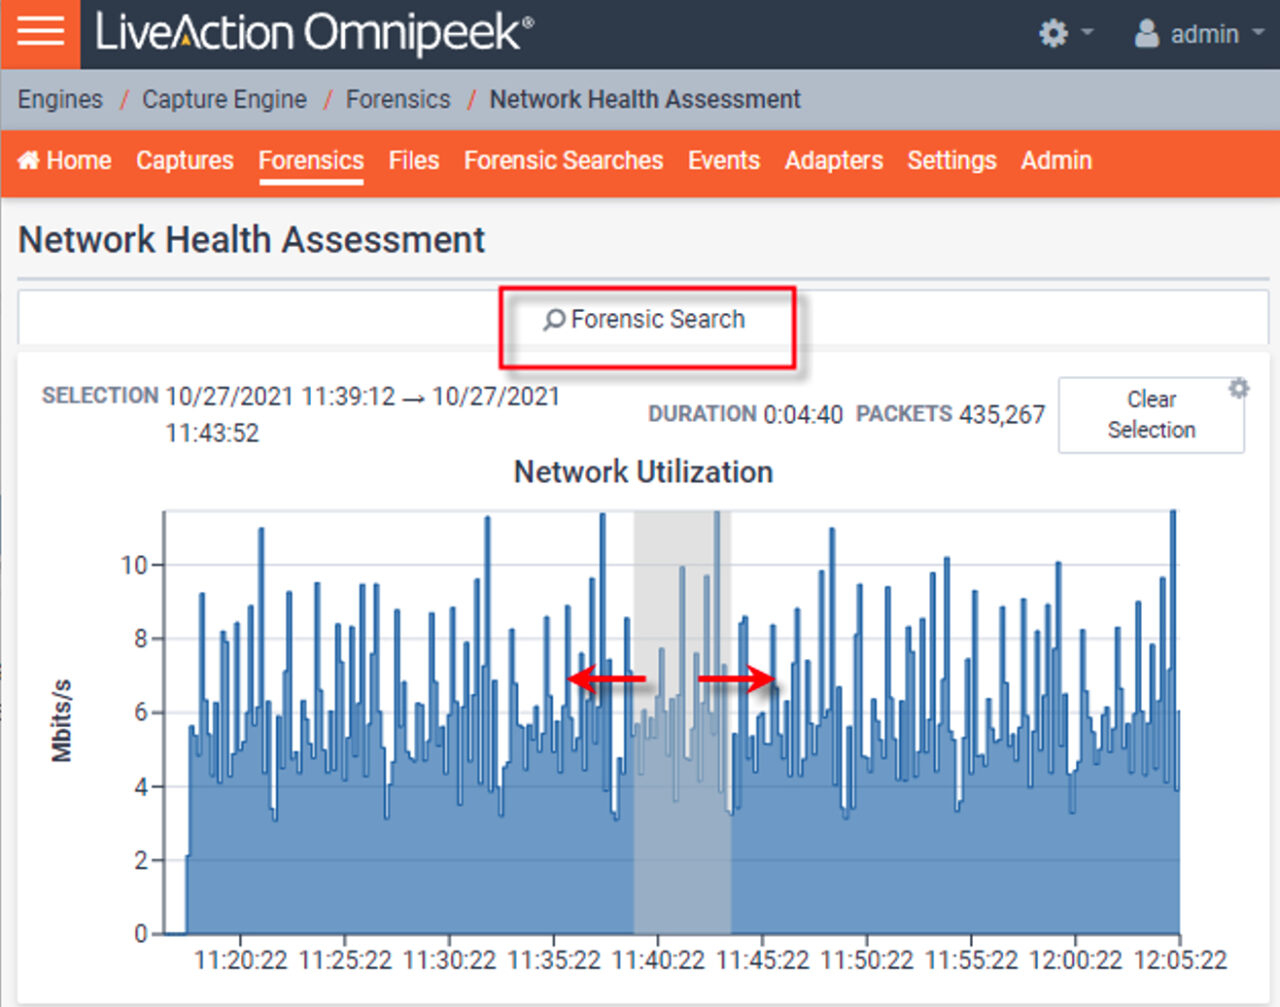
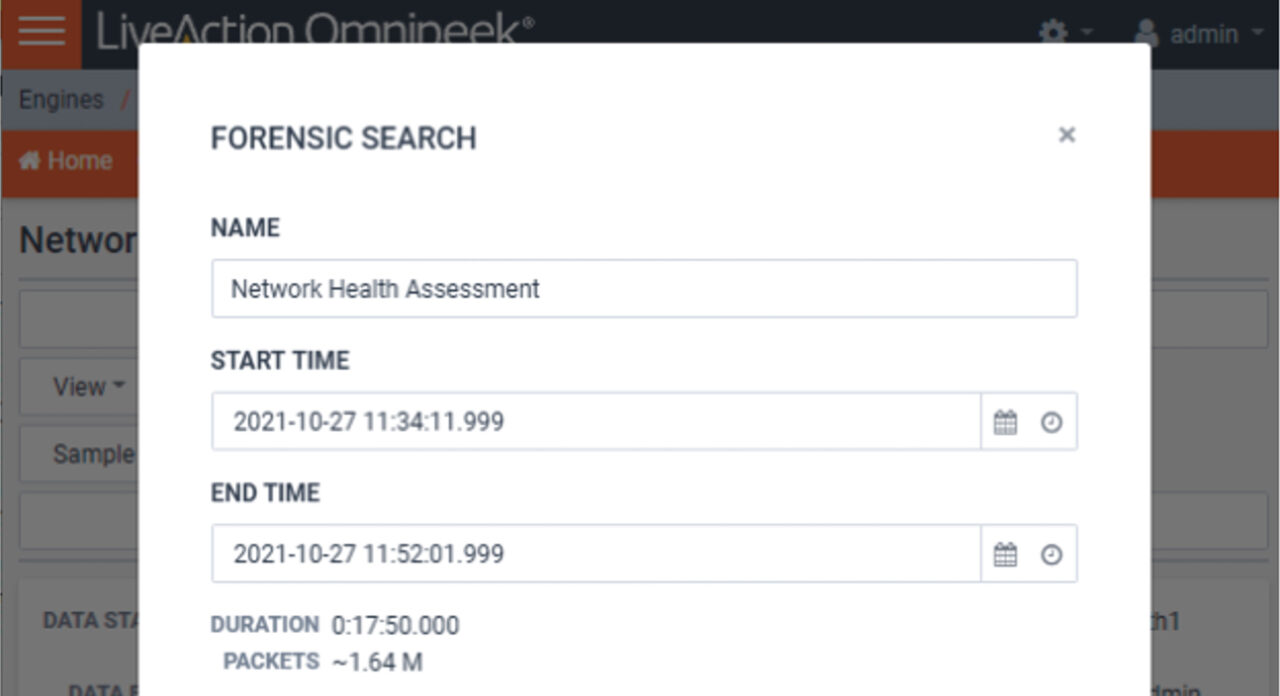
Once the range of time is selected, hit the Forensic Search button at the top right. In the Forensic Search Dialog, name the forensic search something unique, and hit ok.
Analyze
Once the forensic search is done, click on the name, and the various analysis views will appear on the left. Select Compass from the list, and change the pulldown in the upper left of Compass to “2-way Latency”. The graph in Compass will show the application and network latency as separate data series over time.
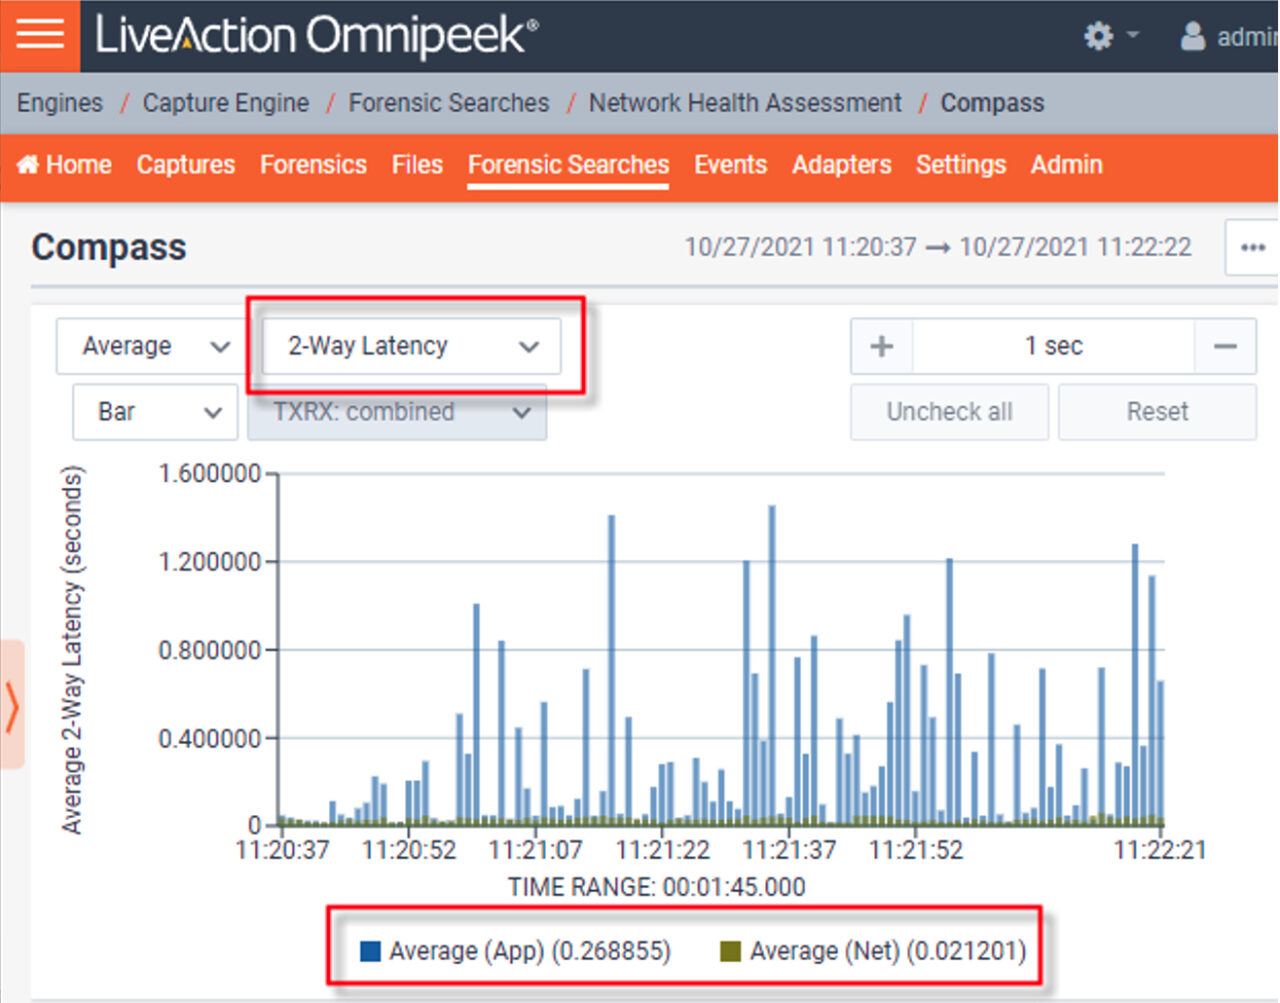
Under the graph is the legend with the Application and Network labels which can be used to turn each one on and off. Turning off one of them will cause the other scale up or down to fill the graph. On most networks the application latency is greater than the network latency. For example, if the application latency anywhere along the time range is over 1 second, the Y-axis in the graph will be at least 1 second. And if the highest network latency is .01 seconds, or 10 milliseconds, then you will hardly be able to see the network latency.
Assess
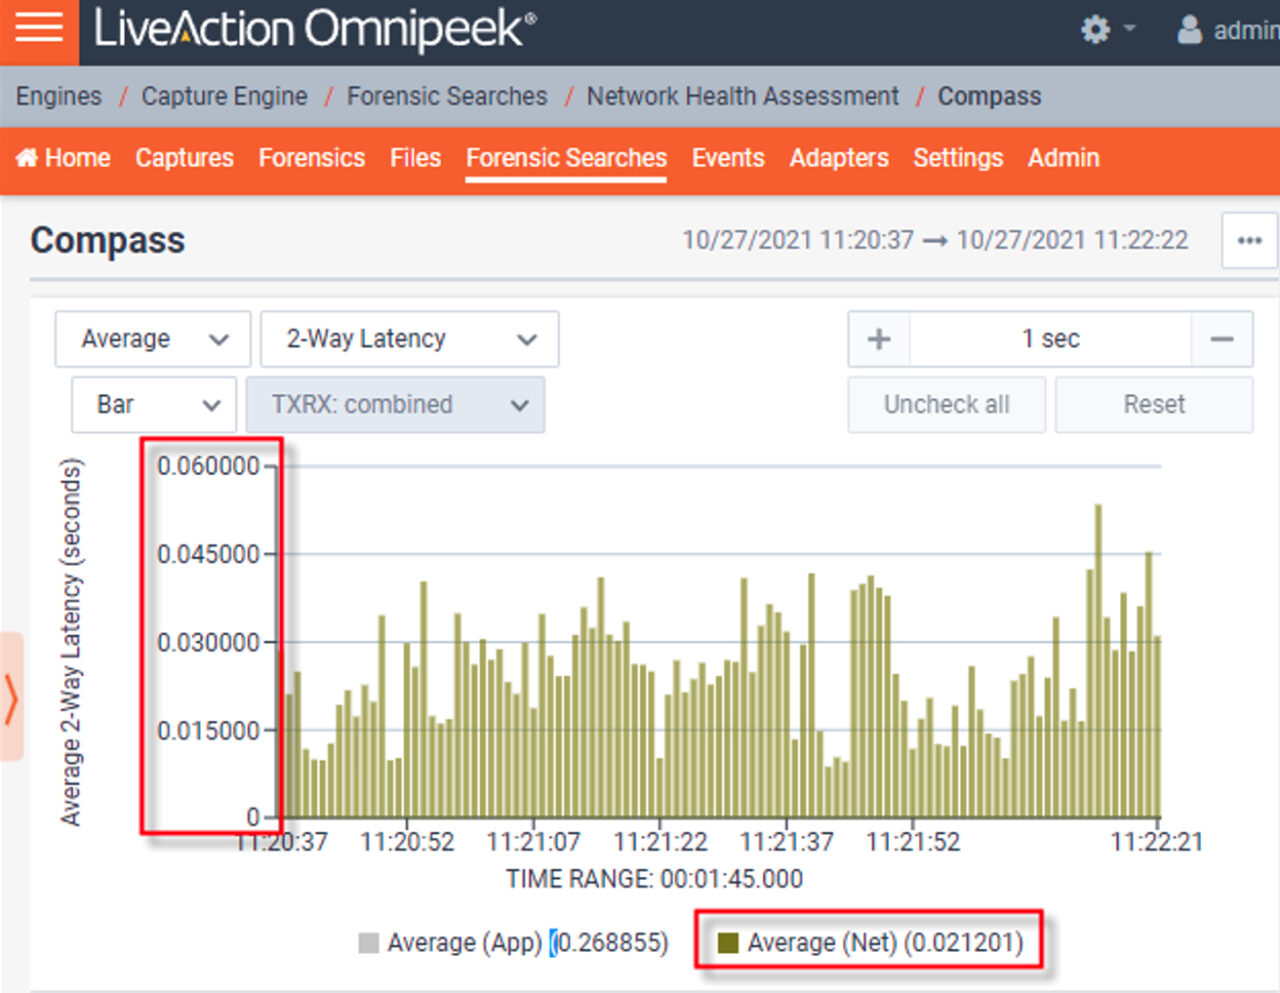
Now, click on the application latency legend to turn it off, and the network latency will scale up so that the Y-axis is at least 10 milliseconds or greater. Typically, if your network latency is less than a second, then the network is doing fine. Ideally though, the network latency would be on average less than 10 milliseconds. As the network latency gets close to 1 second, and over, there may be something wrong with the network.
Now turn the application latency back on in the legend. If there is high application latency, you will be able to see in the lists below what application, protocol, flow, and node has high latency. By clicking on the entries in the lists they will be displayed in the graph above over time.
Summary
At this point you know if there is latency, whether the latency is the network or the application, and if it is the application, which application, and users are experiencing latency. Take some screenshots of these graphs and send them to the appropriate team, as proof of the source of the latency, who it is affecting, and when.
From here, the Select Related Packets feature can be used to drill down to the packets, where more analysis can be done to determine the root cause. But most likely, the packets will have to be correlated by either the network team, or the application team with other information specific to the network architecture or the applications running it.
Regular Checkups
Performing a network health assessment on a regular basis is important to the maintenance of your network, just like getting a checkup regularly from your doctor is important to your own health. Using LiveWire you are able to do a network health assessment as often as you like, whether it is everyday, or once a month.
More ways to perform Network Health Assessments with LiveWire
Using Compass to quickly determine if there is latency, and whether it is the network or the application is an easy and quick workflow, but there are many other types of analysis and workflows in LiveWire that can be used to perform a network health assessment, and to drill down into the specific health issues, and troubleshoot them. So stay tuned for more of these written and video guides from LiveAction.