Large Bank Deploys LiveNX for Planning, Deploying and Optimizing WAN Project

Contents
Day 0 – Baseline and Planning:
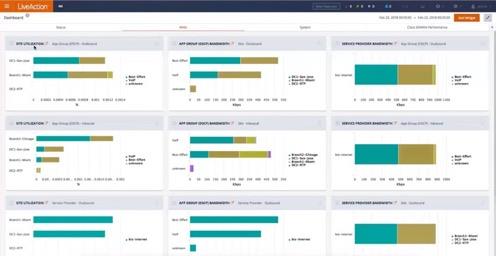
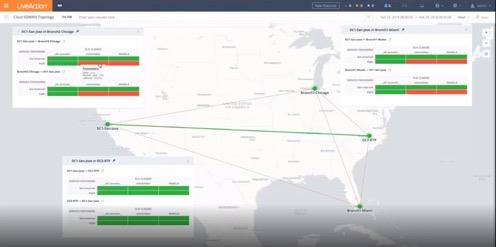
The bank required a baseline understanding of what was running in their network. They found that LiveNX includes a real-time network topology mapper to devices, interfaces, applications, VPNs, and users. Additionally, LiveNX also provide other useful visual analytics for baselining policy and behaviors such as:
- Site-to-site visual analytics to discover traffic types and paths and understand behaviors between sites.
- Application behavior charts and graphs to baseline SLAs and application consumption patterns – bandwidth and class
- Service provider analysis answering questions like:
- Which service provider path should applications take, site by site?
- What applications to include in application route policies?
- What are impacts to QoS policies?
Day 1: Build and Deploy
A deciding factor in choosing LiveNX is LiveNXs’ ability to scale to over 10,000 devices, capability to verify polices at scale, and strength in optimizing tunnel, traffic, and application performance, such as:
- Validating application routing through intuitive visual analytics
- Ability for historic replaying to troubleshoot difficult problems and identify root cause
- Ability to make it easy to spot outliers and issues that are normally “hidden under the hood”
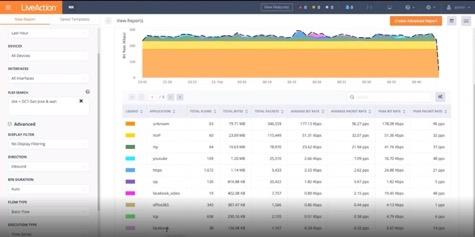
- Reporting for capacity planning to ensure the network supports critical traffic
During deployment, the online bank used LiveNX to identify Intermittent asymmetric VoIP routing issues (Cisco IOS defect causing traffic-class churn at hub site), optimize traffic flow from branches to data center to address routing loop issues, and verify WAN application traffic steering.
Day 2+: Optimizing Network Operations
Once deployed, the online bank used LiveNX’s patented visual analytics and dashboards, daily, to monitor alerts, WAN utilization and drops. The NetOps team leveraged application dashboards to monitor performance of their most popular applications, used QoS dashboards to identify performance trends (at sites, for application groups, and with their service provider), and optimize their WAN capacity planning with easy to use reports.
Ultimately, the bank found LiveNX provided the scale and breadth of functionality needed for enterprise visibility, path analysis, and ongoing WAN capacity planning needed for a successful WAN deployment.
About LiveAction®
LiveAction provides end-to-end visibility of network and application performance from a single pane of glass. We provide enterprises with confidence that the network is meeting business objectives, full network visibility for better decisions, and reduced cost to operate the network.