Accelerating Network Troubleshooting Requires a Modern Performance Management Platform

Contents
What difference can a Network Management Platform (NPM) make in network troubleshooting?
Quite a big difference, in fact. If aligned with a troubleshooting workflow, NPM can accelerate troubleshooting before downtime becomes an issue.
Read our eBook to discover:
- The 8 most important types of data to pinpoint performance issues
- Our 4-step troubleshooting workflow
- Examples of troubleshooting acceleration for common use cases including:
- Poor video /VoIP quality
- Network slowness
- SD-WAN performance issues
- Help your enterprise compete in any environment. LiveAction’s NPM platform is optimized for accelerated troubleshooting so you can get back to steady-state sooner.
The Network Troubleshooting Challenge
Once a network operations team detects a service problem, it must race to solve it. Every minute of downtime disrupts revenue generation, business processes, and customer relationships.
Network operations teams can minimize these impacts by accelerating network troubleshooting, but they require a network performance management (NPM) platform that is optimized for the troubleshooting process. Unfortunately, a variety of factors complicate troubleshooting.
Network complexity
An up-down status will not give you a full explanation of a network or application performance problem, because networks are extremely complex. That complexity is driven by:
- Multiple vendors across switching, routing, Wi-Fi and network security
- Multiple network domains, including data centers, the cloud, local-area networks, and wide-area networks
- Massive scale, with dependencies that grow exponentially
Data complexity
Network managers collect and analyze a wide variety of data. The data most important to network troubleshooting, according to analyst research, include1:
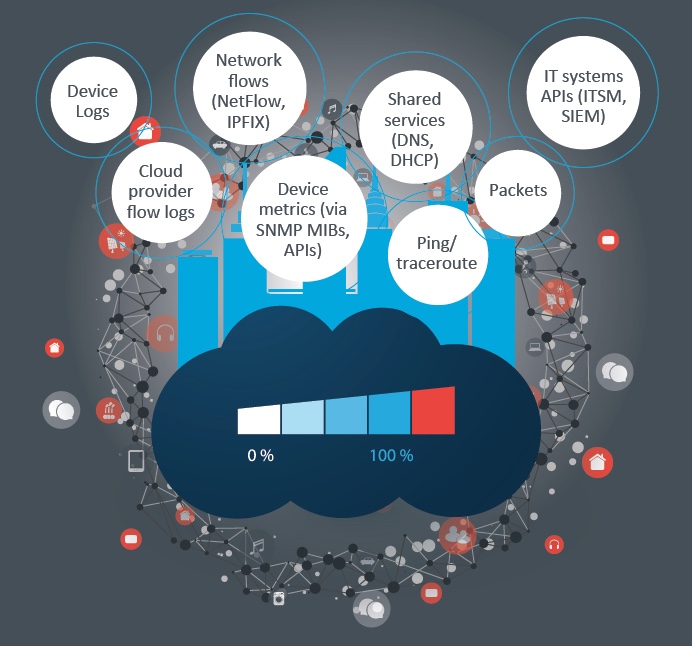
Correlation of this data is essential to troubleshooting, but many network operations teams struggle to do this effectively.
Tool sprawl
The typical IT organization uses 4 to 10 tools to monitor and troubleshoot the network.2
- Network managers must correlate insights across these tools.
- Troubleshooting workflows are not well defined. Network management tools are often ineffective at supporting fault isolation and root-cause analysis.3
- Network complexity exacerbates this issue, especially when a network manager uses discrete tools to monitor and manage individual network domains or individual vendors.
- Consolidation and integration of tools is a best practice. Successful network operations teams prefer fully integrated, multifunction network management platforms.
1 EMA, “Network Management Megatrends 2020,” April 2020.
2 EMA, “Network Management Megatrends 2020,” April 2020.
3 Ibid.
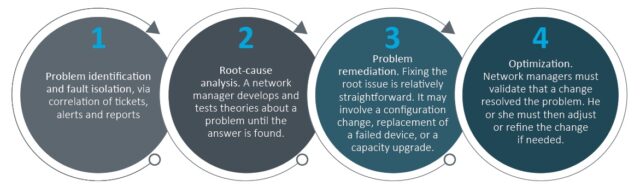
How to Establish Effective Network Troubleshooting Tools and Practices
The typical network troubleshooting workflow has four steps:
Align NPM platforms to the troubleshooting workflow
NPM platforms and operational processes must support the basic troubleshooting workflows with the following:
- Dashboards to provide context
- Alerts to reveal indicators of trouble
- Drilldown workflows to locate reports related to a problem, where network managers can search for a root cause
- Integrations with configuration management tools
Essential troubleshooting platform capabilities
Look for NPM platforms that can provide the following insights:
- Application performance visibility, including application response time and packet drops
- Quality of service visibility, including settings and service-level tags
- Application bandwidth visibility
- Service provider SLA visibility, including MPLS SLA reports and ISP outage reports
- SD-WAN visibility via integration with your SD-WAN overlay provider, if applicable
These insights are gleaned from a variety of data sources. Enterprises need an NPM platform that can collect and correlate multiple classes of data and provide multiple layers of visibility with unified workflows.
Mapping Accelerated Troubleshooting to Common Use Cases
Once a network manager has identified the problem and completed root-cause analysis, the rest of the troubleshooting process is relatively simple. When trying to resolve network issues, network managers should especially look at how their NPM platforms support problem identification and root-cause analysis. Here are examples of how a network operations team can accelerate these critical workflows when it receives one of the following common complaints or tickets.
VoIP or video quality is poor
Real-time applications, such as voice and video, are highly sensitive to network performance issues, such as latency, packet drops, and jitter. Chances are good that this problem is a network issue.
Identify the problem
Review the NPM platform’s console.
- Voice and video conversations with poor Mean Opinion Score (MOS) results should be highlighted.
- Drill down into those alerts for more insight. Use your NPM platform’s search and filter capabilities to isolate alerts related to the ticket to which you are responding.
- Correlate real-time application performance indicators with the location and user to isolate the location of the problem.
Root-cause analysis
There are several workflows for root-cause analysis of real-time communication problems.
- Look for anomalies. Assuming that you have baselined normal voice and video traffic, check custom alerts for anomalous traffic volumes. Use dashboards and reports to look at performance over time and understand normal and anomalous call volumes.
- Run IPSLA jitter tests. Site-to-site tests will reveal network conditions that affect call quality.
- Validate QoS for real-time traffic associated with the relevant voice and video sessions. Check packet headers for voice and video traffic and make sure they are marked with the right Differentiated Services Code Point (DSCP) for real-time traffic.
- Identify infrastructure problems. An NPM platform should provide a hop-by-hop view of the network devices in a conversation path. Look for device problems in the path, such as QoS drops, CPU or memory spikes, or device failures.
- If all else fails, drill deeper into packet captures. An ideal workflow will allow you to drill down from path analysis to packets for the reconstruction of calls.
“The network is slow”
This vague complaint requires a bottom-up investigation. Without a specific application to investigate, network managers will need an NPM platform that investigates broadly at Layer 1 and works its way up to Layer 7.
Identify the problem
Identify the user’s location, the edge devices to which he or she is connecting, and the applications he or she uses.
Review your event management console, dashboard, or reports for alerts tied to the complaining user’s site, the applications he or she is trying to use, a network device associated with the user, or the network path the user’s traffic is traversing.
Root-cause analysis
Dig into the alerts that correlate with the user complaint
- Edge network device alerts, such as CPU and memory utilization, interface errors, interface reachability, device availability, and QoS drops.
- Network and site alerts, such as BGP peer connection changes, IPSLA tests, routing adjacency state changes, site reachability, Layer 2 topology changes, and WAN interface utilization.
- Application alerts, such as network delay, application delay, packet loss, jitter, QoS marking changes or drops, and application traffic response time.
By correlating a series of alerts associated with the same user, you can find the root cause of a general “slow network” problem. An advanced NPM platform should make it easy for a network manager to correlate these insights through well-defined workflows.
Software-defined WAN performance problems
Software-defined WAN (SD-WAN) is a new layer of infrastructure aimed at simplifying WAN engineering and operations. It is a network overlay that aggregates, optimizes, and secures multiple WAN links. SD-WAN solutions offer native visibility into the SD-WAN overlays, but their visibility into the WAN underlay is limited. Ninety-one percent of SD-WAN implementations require a third-party NPM platform for monitoring and troubleshooting.
When a user at an SD-WAN connected site complains about any kind of performance problem, start an SD-WAN-centric troubleshooting process in your NPM platform.
Identify the problem
An NPM platform should collect data from the SD-WAN overlay, the WAN underlay, and connected sites. The platform should present alert summaries and dashboards grouped by applications, SD-WAN overlay tunnels, WAN sites, and underlay service providers. This contextual presentation will reveal the location of a problem.
Root-cause analysis
Start by looking at site-to-site views of associated alerts and reports organized around the following parameters:
- WAN application performance
- SD-WAN tunnel performance
- QoS settings
- Device status of SD-WAN gateways, routers, firewalls, and other elements on the site-to-site path
Use visual path analysis to look for correlations between these site-to- site views. For example, a problematic SD-WAN tunnel is traversing a service provider that is reporting an outage.
Refer to any available historical data in your NPM platform to see how things have changed over time, including changes in traffic, changing in routing, and delays on network paths.
Drill into the raw data to complete the troubleshooting process. Useful data includes device metrics, network flows, IPSLA tests, and data reported by the SD-WAN solution. This data should show you what happened and point to the potential fix.
Make Sure Your Network Performance Management Platform is Ready
Many network managers say their toolsets are weakest with problem identification and root-cause analysis. To keep your network optimized and high-performing, make sure you have these capabilities in your NPM platforms:
- Layers 1-7 visibility
- Diverse data fluency
- Path and traffic visualization
- Insight correlation (apps, traffic, devices, sites, people)
- Compatibility with next-generation network technology (SD-WAN, cloud networks, IoT)
- Historical data retention for forensic analysis and re-investigation of complex and recurring problems
With the right NPM platform optimized for accelerated troubleshooting, a network operations team will help a digital enterprise compete in any environment.
Download eBook
Accelerating Network Troubleshooting Requires a Modern Performance Management Platform: LiveAction eBook
Download Your Free LiveNX Trial
About LiveAction®
LiveAction provides end-to-end visibility of network and application performance from a single pane of glass. We provide enterprises with confidence that the network is meeting business objectives, full network visibility for better decisions, and reduced cost to operate the network.