LiveNX Enables SD-WAN Visibility

Contents
Whether it’s Cisco, Fortinet, or other leading SD-WAN vendors, LiveNX has deep integrations to bridge visibility silos in your SD-WAN integration.
Follow LiveAction’s 3 – day deployment plan, including:
- A list of what should be defined before an infrastructure change
- Important questions to answer about network visibility on the rollout day
- How to approach sustainable, long-term monitoring with LiveNX features
Do you know the key challenges with SD-WAN visibility? Get equipped with LiveAction’s broadest telemetry platform on the market to prepare you for a successful digital transformation.
Network Data is Not Network Visibility
The digital world has changed with the global lockdown proving that network technology can reliably support society through unprecedented tectonic shifts in business and workforce dynamics. Seemingly all at the same time and effortlessly, users are able to receive the data, voice, and video that allows them to work remotely as well as satisfy their personal lives. But those who can peer behind the curtains and see the supporting network infrastructure know that, while the Internet did not break under the exceptional demand of the pandemic, years of layering new technologies on existing technologies has made them very complex.
How complex? Tallying up the number of existing nodes and alternative paths in a network is one way to measure the complexity of networks, but new technologies—artificial intelligence, the internet of things (IoT), multi-cloud environments, network virtualization and software-defined networking—are adding novel dimensions that are pushing network complexity beyond counting devices.
Fortunately, networking data is available, abundant even, and coded within it is a living image of the behavior of the network system. The challenge is that abundant data does not equal visibility, and just as companies have deployed multiple tools to understand the behavior of their networks better, those innovative technologies that are making networks better but more complex have exponentially expanded the volume, diversity, and speed at which data is now coming at them.
Software-defined Wide Area Networks
The ability to manage these ever more complex networks effectively and efficiently is important for enterprises that are routing more of their traffic through the Internet to other data centers and the public cloud. Companies are doing this through software-defined technologies like SD-WAN.
SD-WAN benefits organizations by using software to control the connectivity, management and services between data centers, branches or cloud instances. It effectively decouples the data plane, how data transfers over the physical network, from the control plane, the intelligent component that acts as a traffic controller and policy engine. Previous transit controls were hardware-centric and rigid—think routers making all traffic choices. But with software-defined controls, network owners can easily configure and reconfigure their physical architecture, swap out components, increase or redirect capacity, all while the functional network remains available to users. In other words, decoupled controls enable expanded network policy creation for complex networks.
Enforcing policies, though, requires network visibility, processes and mechanisms for evaluating policy violations.
Visual Network Analytics Reveal Data Insights
Policy decisions are best made based on real insights of network behavior. SD-WAN virtualization approaches have introduced significant dynamism into networks. This means admins need to understand both physical and virtual representations of the network and see individual flows, applications, geographic topology, logical topology, and more. Non-visual methods of representing these dynamic networks will always fail to convey a complete picture. Visual representations of data are more intuitive, making them significantly easier to locate critical information for troubleshooting, planning, and cybersecurity.
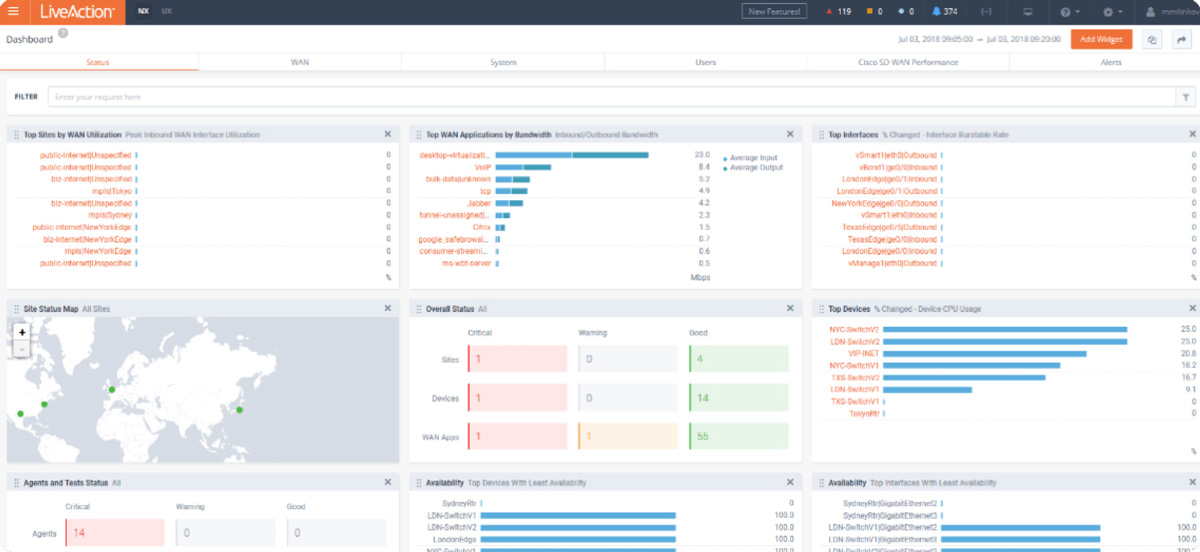
Leading vendor-agnostic network visibility solutions provider, LiveAction, has expanded enterprise SD-WAN solutions with a visual single-pane-of-glass capability (figure 1), which includes wider and deeper network reporting, broader network monitoring sophistication, and the setting of thresholds and alerts, ultimately giving organizations a broader perspective of their entire physical and virtual network. Using comprehensive and interactive visual representations of network traffic helps teams with their Day 0/ Day 1/ Day 2 design and deployment lifecycle management or SD-WAN migrations.
Day 0/ Day 1/ Day 2 Delivers Measurability
The following framework outlines three phases (plan, deploy, optimize) in the continuous integration/continuous delivery (CI/CD) lifecycle, popularly shortened to “Day 0/ Day 1/ Day 2”. This approach is useful in deploying policy governed SD-WANs founded on the practice of baselining. Baselines establish network measurability—and thus what is measurable is improvable. By baseline comparison, intent-based policies can then be set up to improve network performance while honoring partner SLAs.
During the Day 0 phase, a policy foundation is discovered by baselining the network, which reveals the network’s honest usage and characteristics—in terms of bandwidth, response time, delay/latency and packet loss—whether the network was previously using intent-based policies or not. Based on Day 0 insights, organizations can create a wide array of policies to govern many aspects of the SD-WAN including traffic routing and bandwidth limits. The business aligns its network policies with business needs and deploys the SD-WAN to a subset of the network to test its viability and compatibility.
During Day 1, the network is deployed, monitored, and network policies are verified in real time, accessible through visual dashboards. This includes inter-site flows, and application transport paths, usage, and performance. After Day 0 proof of concept (POC), other network segments are incrementally brought into the SD-WAN core network.
During Day 2, the majority of sites are deployed under the SD-WAN, and then verification that new networks are joining and policies are being adhered to in a controlled fashion is ongoing. If significant changes to network usage are normalized, new baselines can be established by returning to the same process in Day 0. This stage is where advanced network performance visualizations and analytics demonstrate ROI.
Day 0: Baseline and Planning for Policy Design
Day 0 is essential for establishing pre-SD-WAN-deployment performance baselines that support effective policy creation and network performance improvements. In effect, a baseline is a snapshot of the current network usage at expected low, normal, and peak operating times. Baseline usage compared with the intended use of the network is an integral starting point for measuring improvements and should not be overlooked.
Vendor-agnostic solution, LiveNX, is capable of monitoring existing SD-WAN networks from multiple vendors to baseline an accurate and comprehensive view of usage. Day 0 planning determines future success in Day 1 and Day 2. Three key areas of attention deserve careful consideration during Day 0 baselining and planning.
Site-to-site Traffic Performance
When considering site-to-site traffic be primarily concerned with which sites are most important from both a bandwidth utilization perspective and a business perspective. LiveNX is helpful in understanding site-to-site traffic performance, first, by categorizing traffic by types and paths, and second, by demonstrating usage patterns and site to site traffic behaviors.
Further, this information is helpful in supporting an SD-WAN POC. While it is never advisable to roll out SD-WAN to an entire enterprise network in a single pass, Day 0 monitoring can help identify target locations with the applications and services that would make acceptable test cases in justifying that the technology is sound enough to move on to Day 1 and Day 2, and eventually bring into the SD-WAN larger network segments.
Application Behavior
Next, consider which applications are in use, and which ones are most business critical. Prioritize these apps when bandwidth is limited. From this point, based on consumption patterns, apps can be classified and whitelisted. Unsanctioned apps, like those contributing to shadow IT, can be blacklisted from the network, freeing up bandwidth.
Better though is to establish an ongoing policy of internal discussions with key business stakeholders that are using unsanctioned apps in good faith ways. Many business-critical apps have begun their use as shadow IT, used by employees proactively searching for solutions to their day-to-day problems. Allowed passage onto the network, these apps can be monitored, baselined, and prioritized, and if found sufficiently valuable, eventually integrated into the company’s IT.
Depending on granular applicability, enterprises may also consider baselining and planning for:
- Critical TCP apps, their network delay and loss
- Realtime apps, their network delay, loss, and jitter
- Custom apps by IP, port, Hostname/SSL Common Name and URI
- Applications that Deep Packet Inspection (DPI) cannot identify
- Assigning QoS markings to critical apps
Service Provider Analysis
Finally, consider service providers and which applications to include in app routing policies. Further consider, through a lens of security, performance, and site by site, which service provider path should apps be taking. Then consider how SD-WAN enabled traffic versus non-SD-WAN traffic may route while the SD-WAN is being deployed.
Day 1: Deployment and Verification at Scale
Day 1 tasks involve deploying a new SD-WAN network with policies, creating policies for an existing SD-WAN to replace or correct outdated policies, or simply to establish policies in the first place.
To keep network visualizations fresh, LiveNX interfaces with Cisco SD-WAN via northbound API connections to vManage drawing in device information and learning about new devices and sites that come onboard. LiveNX helps inform the designs of application aware routing policies through several views.
Policy and Tunnel Performance —are presented on the transport view. During deployment, a geo map helps to quickly verify policy and site behavior based on BFD and flow data. This view is useful in verifying that VPN topology matches policy intent, service providers are performing, and to understanding traffic paths for traffic engineering.
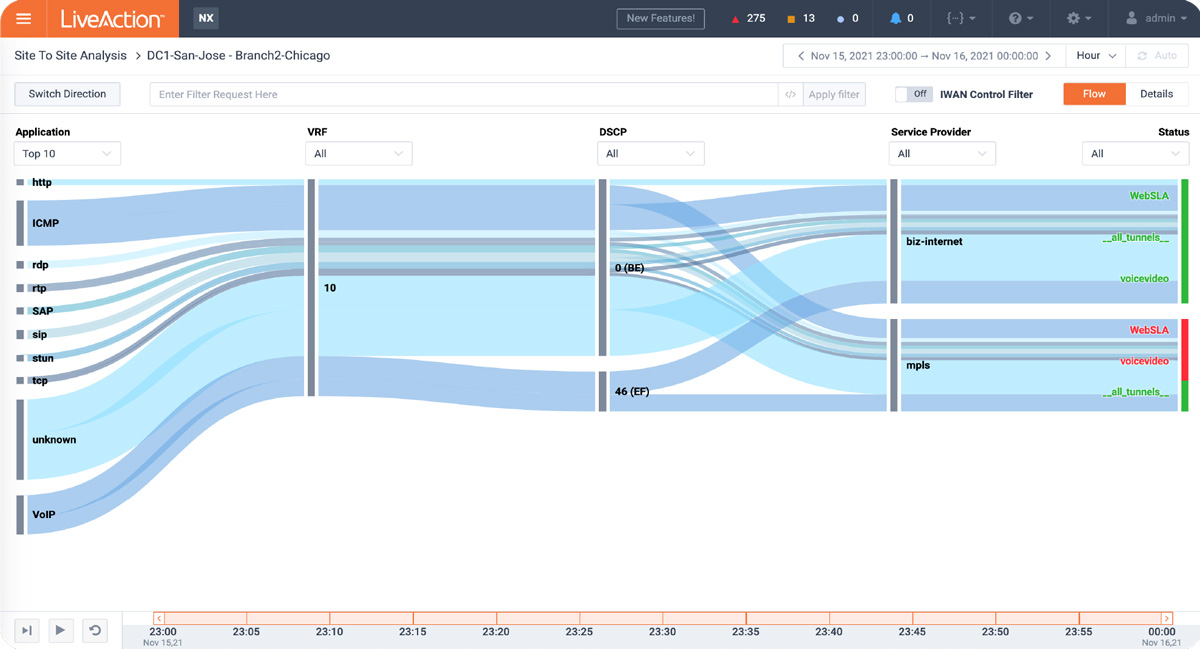
Traffic Performance —Sankey diagrams help show when performance degradations occur (figure 2), useful for verifying application and user traffic is associated to correct QoS markings, service VPNs and service provider paths.
Application Visibility —The Application path and performance view shows in/outbound resource allocation, bandwidth, latency, jitter, and packet loss. Useful in verifying critical applications are traversing the intended service provider path and its performance is within thresholds.
Beyond visual diagrams, LiveNX’s Semantic Tagging feature allows the tagging of devices, sites, capacity, and more.
LiveNX can draw associations based on tags and present to admins real-time situational awareness in specialized reports and topological views. Tags allow network engineers to transfer their knowledge of the network in semantic form into the LiveNX system, ready to be incorporated into real-time monitoring.
Tagging is available for:
- Sites
- Bandwidth Capacity
- Service Providers
- Interface Labels
- WAN Interfaces
- Site IP Mappings
- Site Geo Locations
- Data Center locations
- Device and Interface Tags
Day 2: Operations and Management
During Day 2, IT teams manage SD-WAN operations along three dimensions: sites, applications, and service providers. Incorporating all of LiveNX’s capabilities at managing multi-vendor, multi-domain, and multi-telemetry, NOC teams can utilize LiveNX’s high level dashboards to monitor these three dimensions for performance.
Operational workflows are further supported through LiveNX’s comprehensive alerting system, templated and customizable reports, deep capacity planning features integrations with third-party systems, like IT ticketing providers. With complete network and SD-WAN visibility IT teams are free to place their efforts into improving performance and planning for the future.
Turning Network Complexity into Solutions
While network complexity is challenging, the adage can be said that sometimes within the problem is the solution. Part of the solution lies in within the telemetry and policy data, the second part is the ability to turn that data into actionable insights.
LiveNX taps into these sources, analyzing them to comprehensively visualize the network, and make vital details easily accessible through an intuitive interface—admins can verify policies, validate their path designs, map SLA classes, and monitor the physical and virtual performance of their networks.
Download Solution Brief
LiveNX Enables SD-WAN Visibility
About LiveAction®
LiveAction provides end-to-end visibility of network and application performance from a single pane of glass. We provide enterprises with confidence that the network is meeting business objectives, full network visibility for better decisions, and reduced cost to operate the network.